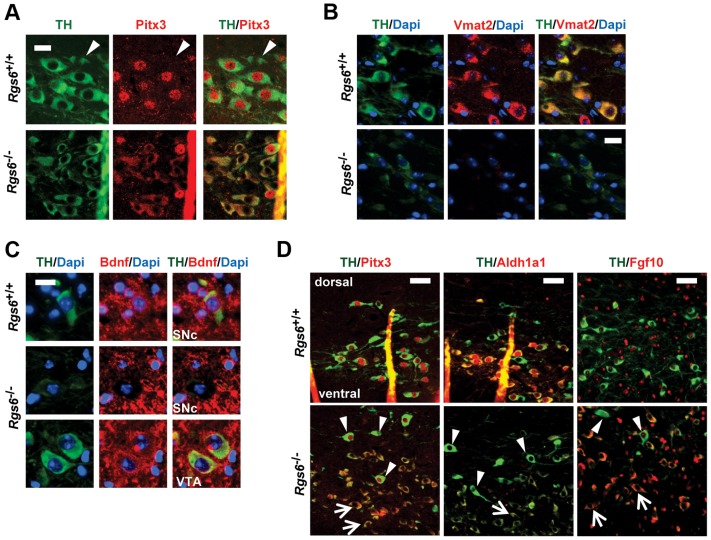
Figure 7. Reduced expression of Pitx3 and its target genes in degenerating neurons.
(A) Double immunofluorescence staining against TH (green) and Pitx3 (red) in SNc of control and 1 y-old Rgs6 −/− mice that display dysmorphic mDA neurons. Arrowheads indicate Pitx3-negative neurons of dSNc. Scale bar 20 µm. (B) Co-immunofluorescence staining against TH (green), nuclear Dapi (blue) and Vmat2 (red) in SNc of WT and Rgs6 −/− mice. Scale bar 20 µm. (C) Co-immunofluorescence staining against TH (green), nuclear Dapi (blue) and Bdnf (red) in SNc and VTA of WT and Rgs6 −/− mice. Scale bar 20 µm. (D) Double immunofluorescence staining against TH (green) and Pitx3, Aldh1a1, Fgf10 (red) in control and 1 y-old Rgs6 −/− mice that display dysmorphic mDA neurons. Arrowheads indicate unaffected dSNc neurons and arrows point to affected vSNc neurons. Scale bar 100 µm.

