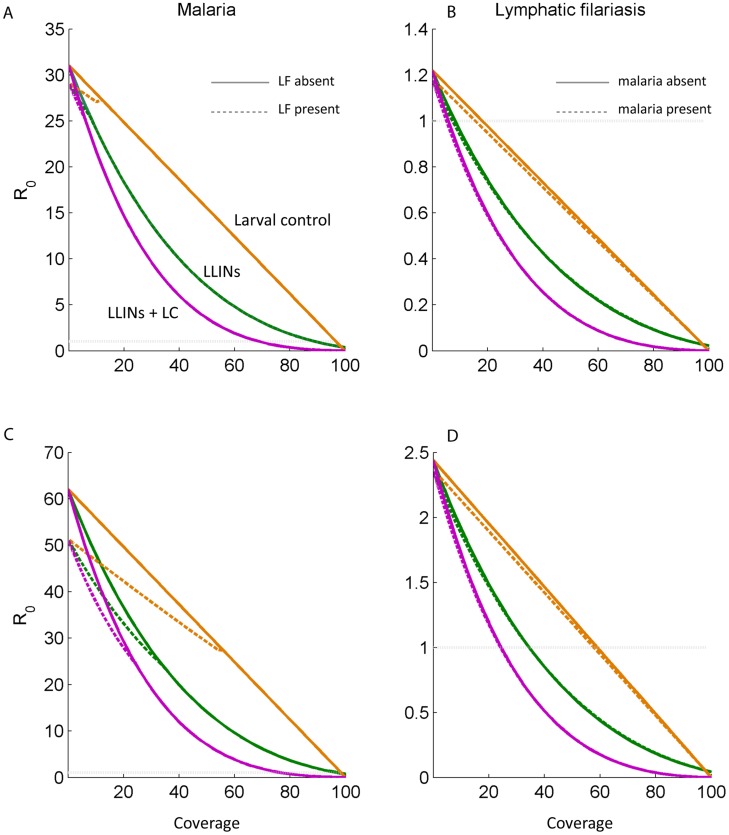
Figure 5. Values of the basic reproductive number, R0, for malaria (panels A and C) and lymphatic filariasis (panels B and D) in the presence (dashed lines) and absence (solid lines) of the other parasite, over different coverage levels of interventions, φ.
The interventions considered were larval control, insecticide-treated nets, and a combination of both. The results for a mosquito density of 80 per human are depicted on a linear scale in panels A–B. Panels C–D depict the results for a mosquito density of 160 per human.

