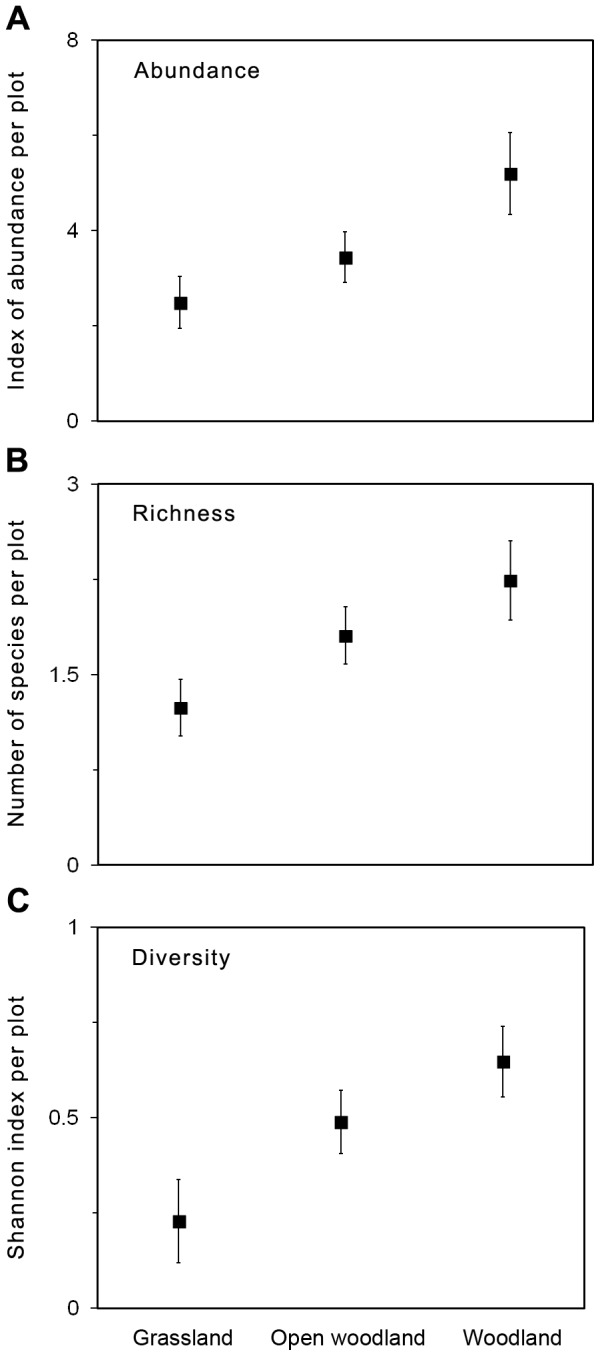
Figure 3. Graphical representation of logistic regression models summarized in Table 2.

The graphs shows mean values for a) reptile abundance, b) reptile species richness and c) reptile species diversity at a given plot for each tree canopy cover class (grassland, open woodland, woodland). Standard error bars are shown. To aid interpretation of results, variables have been back-transformed to original scale.
