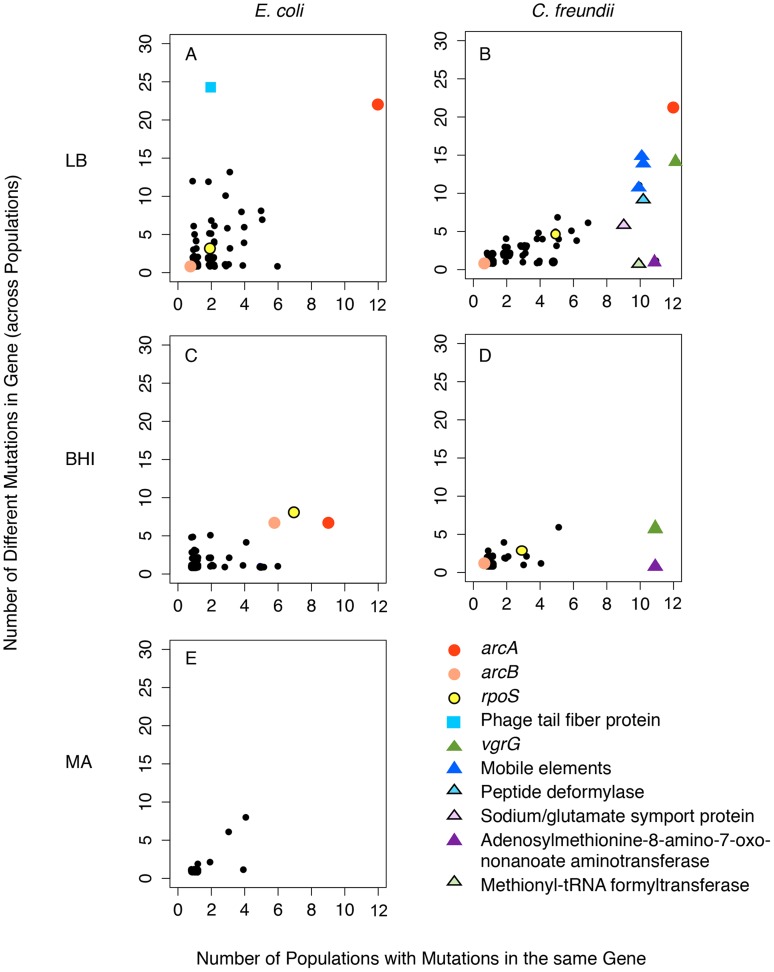
Figure 5. Mutations in arcA and rpoS evolved repeatedly both within and among E. coli populations evolved in LB (A) and BHI (C), and C. freundii populations evolved in LB (B) and BHI (D).
The number of mutations observed in the evolved populations is plotted over the number of populations with mutations in that gene. The scatterplots show all the genes with mutations for the twelve populations evolved in one environment (black circles). Selected genes that evolved in parallel are identified and marked individually, following the legend. None of these evolved genes had mutations in the mutation accumulation lines of E. coli evolved on LB agar (E).

