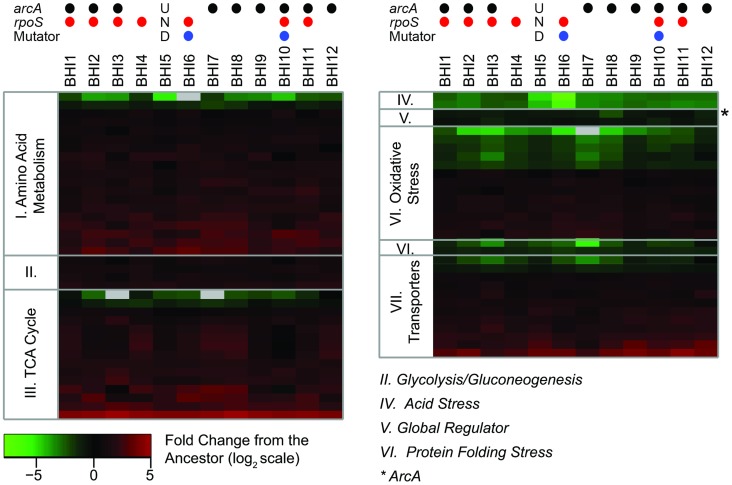
Figure 8. The proteomic analyses shows consistent changes across the evolved populations.
We observed 488 proteins across the twelve evolved and the ancestral populations. Out of those, 166 proteins were significantly different between ancestor and evolved populations as judged by LC-MS based proteomics and then were grouped by function (S1 Text). The heat map shows the change in expression for the groups of proteins that had consistent changes with respect to the ancestor. The complete list of significantly changing proteins is given in S2 Table. Columns represent the BHI-evolved E. coli populations; rows represent individual proteins, grouped by functional categories. The color scale shows the average base-2 logarithm transformed fold change of each protein with respect to the ancestor sample, based on the average of triplicate measurements. Gray indicates that the protein was not detected in that population. Positive values (red) indicate higher expression in the evolved population than the ancestor; negative values (green) represent lower expression in the evolved population than the ancestor. The asterisk indicates the global regulator ArcA. The circles on the top indicate whether we identified mutations in arcA (black) or rpoS (red) in a population (at a minimum frequency of 0.05), and whether the population evolved a mutator phenotype (blue). ‘UND’ stands for undetermined as population BHI5 was excluded from the genomic analyses (see Results).

