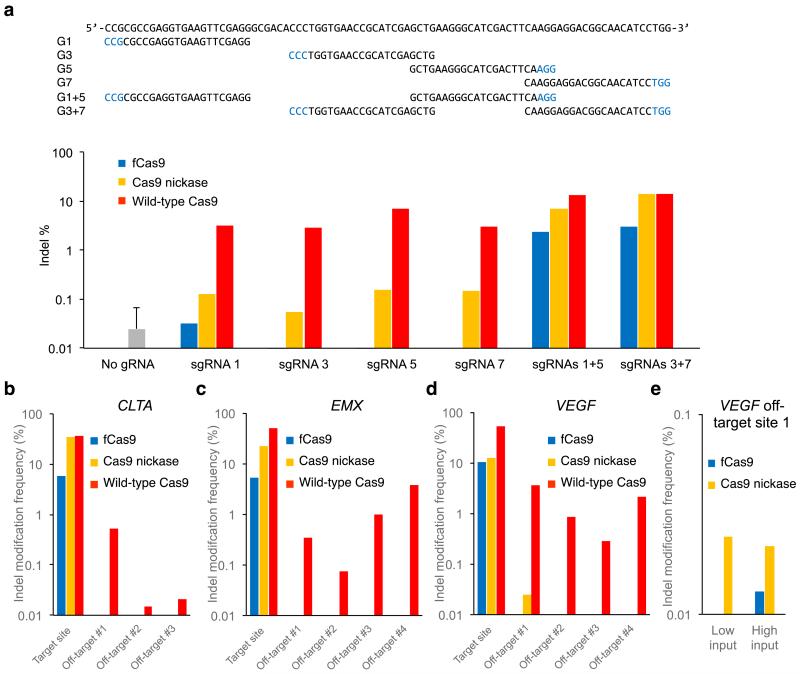
Figure 3. DNA modification specificity of fCas9, Cas9 nickase, and wild-type Cas9.
(a) Results from high-throughput sequencing of GFP on-target sites amplified from 150 ng genomic DNA isolated from human cells treated with a plasmid expressing wild-type Cas9, Cas9 nickase, or fCas9; and either a plasmid expressing a single sgRNA (G1, G3, G5, or G7), or two plasmids each expressing a different sgRNA (G1+G5 or G3+G7). As a negative control, transfection and sequencing were performed in triplicate as above without any sgRNA expression plasmids. Sequences with more than one insertion or deletion at the GFP target site (the start of the G1 binding site to the end of the G7 binding site) were considered indels. Indel percentages are the number of indels observed divided by the total number of sequences. While wild-type Cas9 produced indels across all sgRNA treatments, fCas9 and Cas9 nickase produced indels efficiently (> 1%) only when paired sgRNAs were present. Indels induced by fCas9 and single sgRNAs were not detected at a frequency above that of the no-gRNA control, whereas Cas9 nickase and single sgRNAs modified the target GFP sequence at an average rate of 0.12%. (b-e) The indel mutation frequency from high-throughput DNA sequencing of amplified genomic on-target sites and off-target sites from human cells treated with fCas9, Cas9 nickase, or wild-type Cas9 and (b) two sgRNAs spaced 19 bp apart targeting the CLTA site (sgRNAs C1 and C2), (c) two sgRNAs spaced 23 bp apart targeting the EMX site (sgRNAs E1 and E2), or (d, e) two sgRNAs spaced 14 bp apart targeting the VEGF site (sgRNAs V1 and V2). (e) Two in-depth trials to measure genome modification at VEGF off-target site 1. Trial 1 used 150 ng of genomic input DNA and > 8 × 10⁵ sequence reads for each sample; trial 2 used 600 ng of genomic input DNA and > 23 × 105 sequence reads for each sample. In (b-e), all significant (P value < 0.005 Fisher’s Exact Test) indel frequencies are shown. P values are listed in Supplementary Table 3. For (b-e) each on- and off-target sample was sequenced once with > 10,000 sequences analyzed per on-target sample and an average of 76,260 sequences analyzed per off-target sample (Supplementary Table 3).

