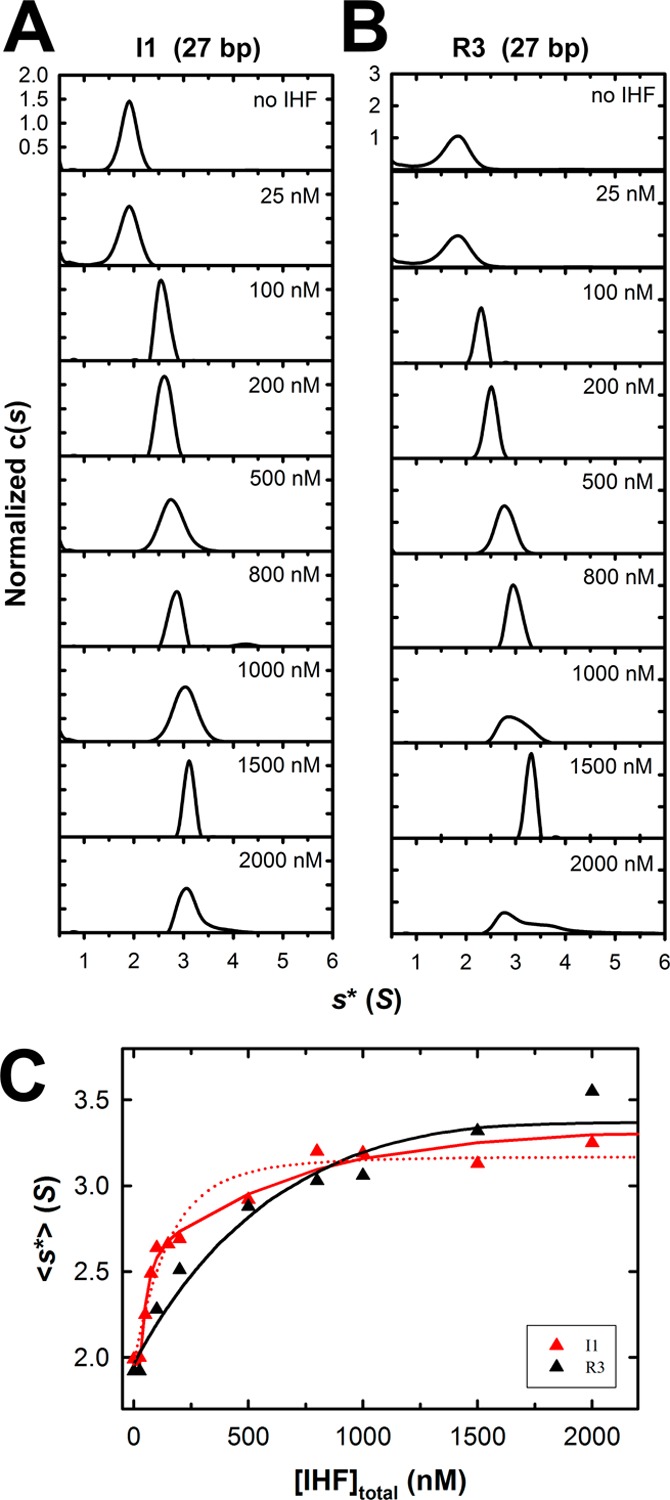
Figure 5.

Interrogation of binding of IHF to minimal substrates using sedimentation velocity analytical ultracentrifugation (SV-AUC). Increasing concentrations of IHF were added to the minimal I1 (specific) and R3 (nonspecific) duplex substrates, and their sedimentation behavior was monitored by SV-AUC as described in Experimental Procedures. The c(s) distribution for each binding experiment was calculated using Sedfit. (A) Normalized c(s) profiles for the specific I1 duplex (27 bp). (B) Normalized c(s) profiles for the nonspecific R3 duplex (27 bp). (C) Weight-average sedimentation coefficients for each of the c(s) distributions shown in panels A (red triangles, I1) and B (black triangles, R3) were calculated using Sedfit and are plotted as a function of IHF concentration. The red dotted line represents the best fit of the I1 binding data to the nonspecific finite lattice DNA binding model, which does not adequately describe the data. The solid lines represent the best fit of simultaneous (global) analysis of the R3 (black) and I1 (red) binding data to (i) nonspecific finite lattice DNA binding and (ii) competitive specific/nonspecific finite lattice DNA models, respectively. The binding parameters derived from global analysis are presented in Table 1.
