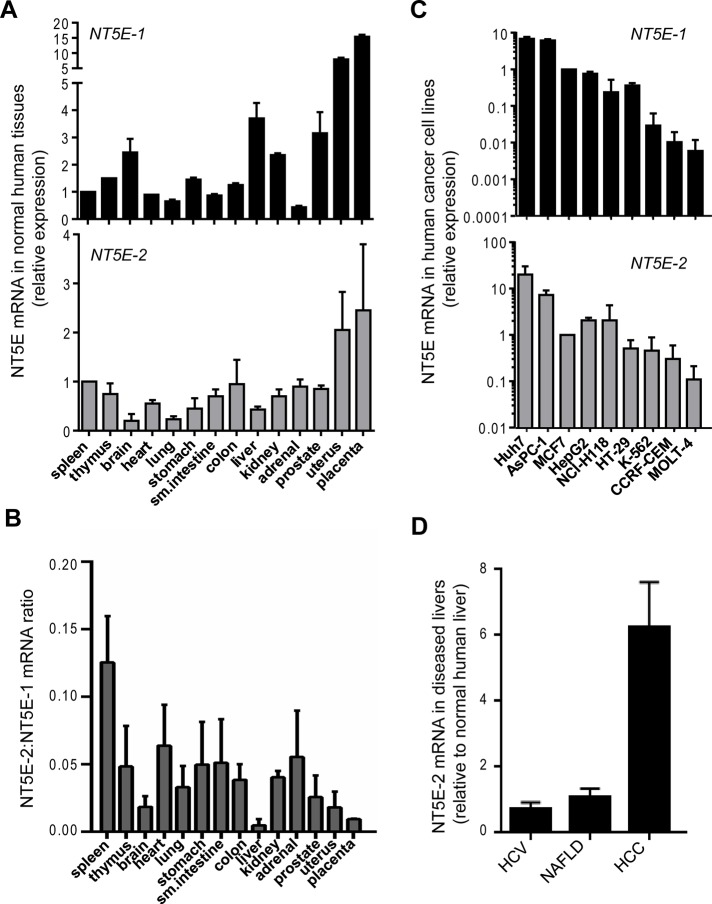
FIGURE 2:
Comparison of the mRNA levels of NT5E-1 and NT5E-2 in normal human tissues, cancer cell lines, and diseased human livers. (A) NT5E-1 (NM_002525) and NT5E-2 (NM_001204813) mRNA levels in different normal human tissues (fold change over spleen, which is set to 1). (B) Relative abundance of NT5E-2 to NT5E-1 in normal human tissues. (C) Relative abundance of NT5E-1 and NT5E-2 in different human cancer cell lines (MCF7 = 1). (D) Comparison of NT5E-2 mRNA in livers of patients with HCV (n = 4), NAFLD (n = 4), and HCC (n = 6) to normal human livers (n = 2).

