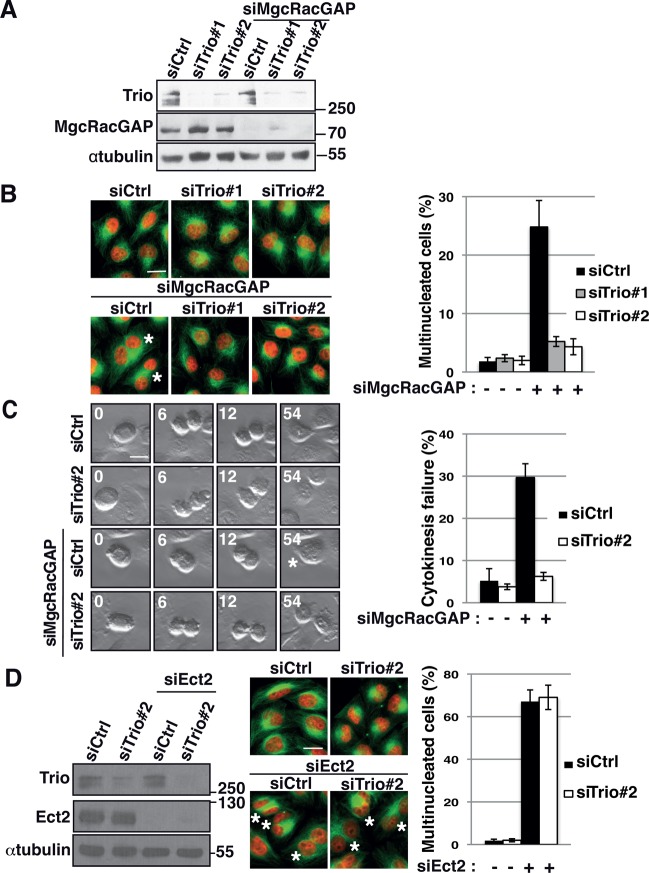
FIGURE 2:
Trio depletion rescues the cytokinesis failure induced by the depletion of MgcRacGAP. (A) Western blot showing the amount of Trio and MgcRacGAP 30 h after siRNA transfection. siRNA conditions include control siRNA (siCtrl) and two independent siRNAs against Trio (siTrio#1, siTrio#2) alone or in combination with MgcRacGAP siRNA (siMgcRacGAP). α-Tubulin, loading control. Molecular weight is indicated in kilodaltons. (B) Immunofluorescence of HeLa cells stained with DAPI (nuclei, red) and α-tubulin (green) to visualize multinucleated cells upon MgcRacGAP depletion. siRNA conditions, as indicated. Asterisks, multinucleated cells. Scale bar, 20 μm. Graph shows quantification of the percentage of multinucleated cells. n = 500 cells; three independent experiments. Mean ± SEM. (C) Frames from movies showing cells undergoing cytokinesis. Cytokinesis failure is observed in MgcRacGAP siRNA–treated cells but not in control, Trio2, or Trio2/MgcRacGAP siRNA–treated cells. Asterisks, multinucleated cells. Time (minutes) is indicated in the upper left corner. Scale bar, 20 μm. Graph shows quantification of the percentage of dividing cells undergoing cytokinesis failure at the end of the first division after siRNA transfection. n > 30 cells/experiment; three independent experiments. Mean ± SEM. (D) Western blot showing the amount of Trio and Ect2 30 h after siRNA transfection. siRNA conditions include control siRNA (siCtrl) and Trio siRNA alone or in combination with Ect2 siRNA (siEct2). α-Tubulin, loading control. Molecular weight is indicated in kilodaltons. Immunofluorescence of HeLa cells stained with DAPI (nuclei, red) and α-tubulin (green) to visualize multinucleated cells upon Ect2 depletion. siRNA conditions, as indicated. Asterisks, multinucleated cells. Scale bar, 20 μm. Graph shows quantification of the percentage of multinucleated cells. n = 500 cells; three independent experiments. Mean ± SEM.

