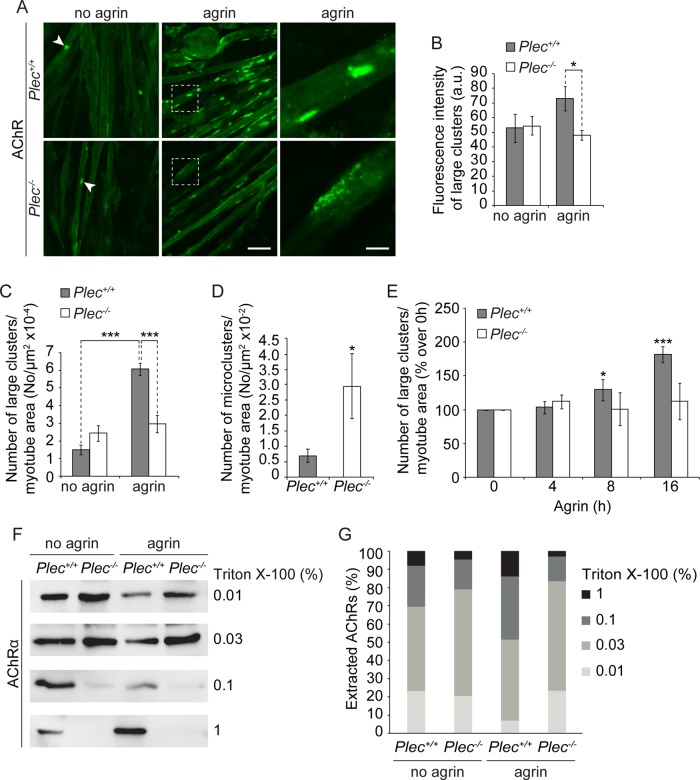
FIGURE 1:
Analysis of cluster formation and detergent extractability of AChRs. (A) Representative images of Alexa 488–α-BTX–labeled AChR clusters forming spontaneously (no agrin; white arrowheads) or in the presence of agrin. Right, higher magnification of boxed regions in middle. Note that fragmented and less compact clusters (typical of plectin-deficient cells) are rarely seen in Plec+/+ cells. Bars, 30 μm (left and middle); 10 μm (right). (B) Statistically evaluated fluorescence intensities (recorded bellow fluorescence saturation) of large (≥5 μm2) clusters. Plec+/+, n = 114; Plec−/−, n = 218 clusters examined. (C, D) Quantification of large (C) and small (<5 μm2; micro, D) clusters per total myotube area visualized. Myotubes analyzed: Plec+/+, 271, and Plec−/−, 357 (C); and Plec+/+, 57, and Plec−/−, 38 (D). Note that upon agrin treatment, Plec−/− myotubes form approximately half as many (and ∼1.3-fold less dense) large clusters compared with Plec+/+ cells. (E) Quantification of agrin-induced clusters at different time points (presented as percentage increase over 0 h). Note that only Plec+/+ cells were responsive to agrin. Myotubes analyzed per time point: Plec+/+, ≥200; Plec−/−, ≥203. (F) Immunoblotting (using antibodies to AChR subunit α) of affinity-purified (biotin–α-BTX) AChRs after sequential extraction of Plec+/+ and Plec−/− myotubes with indicated concentrations of Triton X-100. (G) Bar diagram showing proportional extractability (%) of AChRs at various concentrations of detergent. Mean ± SEM, three experiments (B–E), five experiments (G), each. *p < 0.05 and ***p < 0.001 compared with Plec+/+ (D) or Plec+/+ agrin/no agrin/0 h (B, C ,E). Unpaired Student's t test.

