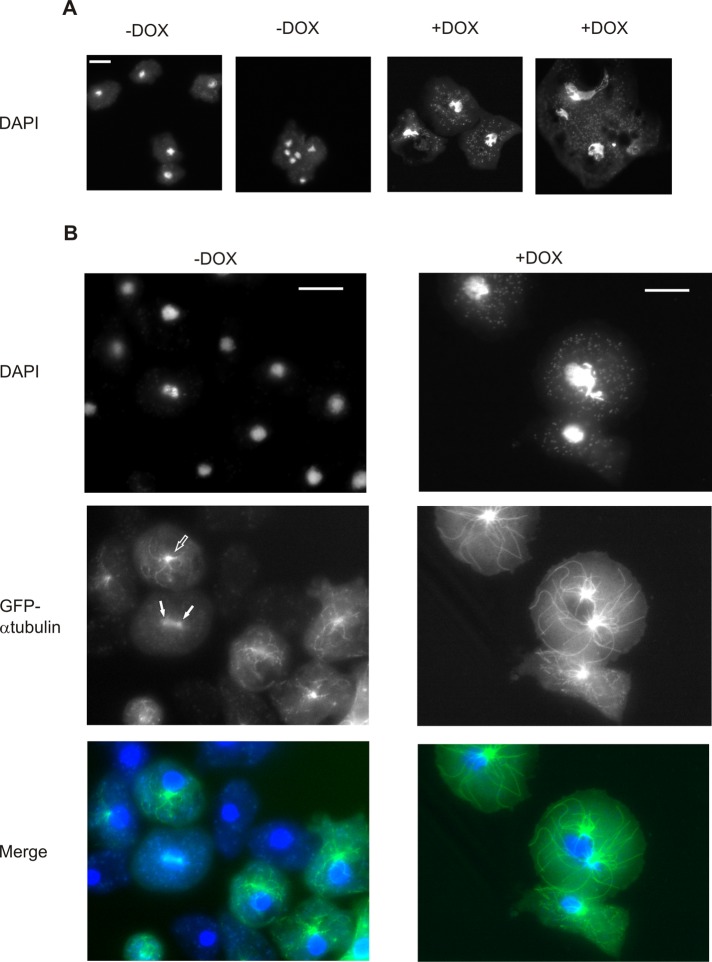
FIGURE 3:
Size and shape of the nucleus and microtubular cytoskeleton are affected by expression of hyperactivated Rap1. Images of Dictyostelium Rap1G12V (+DOX) and control (−DOX) cells. Shown are (A) cells stained with DAPI and (B) cells coexpressing GFP–α−tubulin. Interphase MTOC is marked with open arrows, while mitotic structures are indicated with closed arrows. Scale bars: 10 μm.

