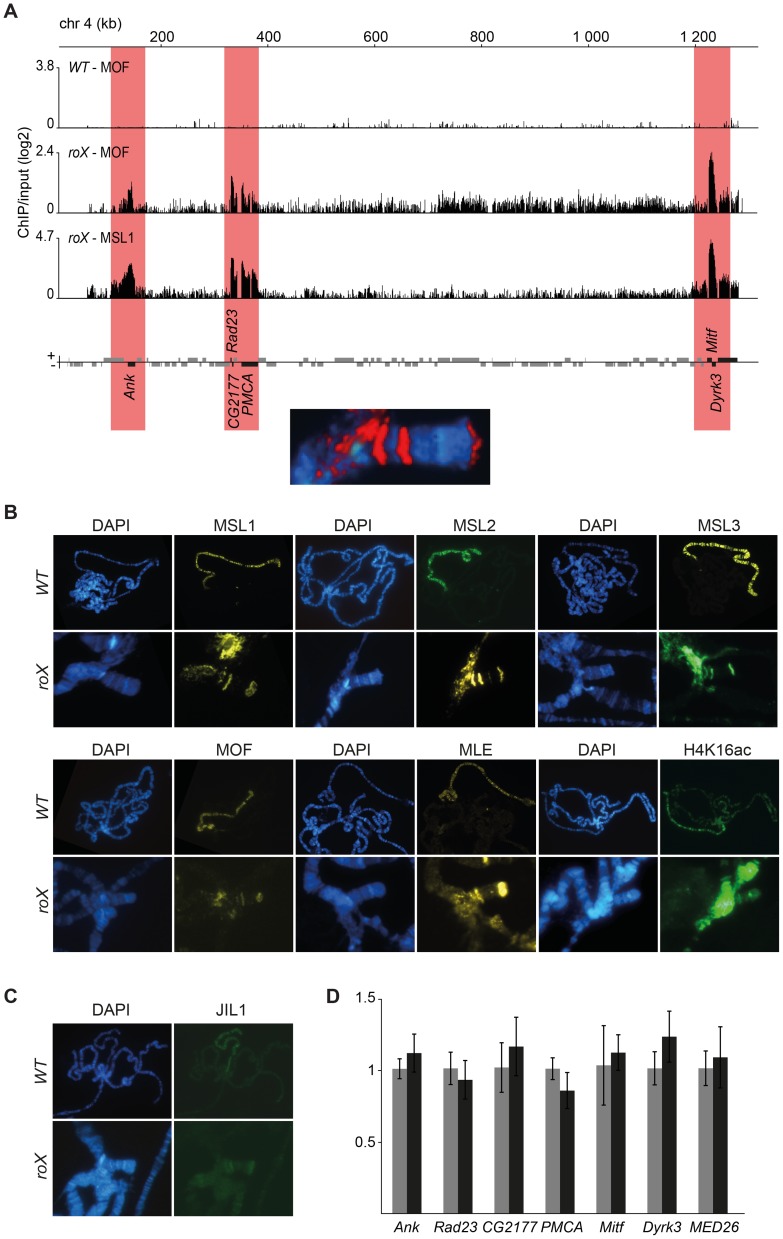
Figure 3. A complete and enzymatically active MSL-complex is assembled in the absence of roX.
(A) MOF and MSL1 ChIP-seq enrichment profiles, with a 500 bp smoothing, for the entire 4th chromosome in salivary gland tissue from wild type and roX mutant males. Numbers along the x-axis denote chromosomal positions along the chromosome in kb. The y-axis shows the ChIP enrichment over input as log2 ratios. Genes expressed from left to right and vice versa are shown above and below the horizontal lines, respectively. Note that the genes targeted in roX mutants (indicated by red boxes) correspond to the three bands seen in polytene chromosome staining (below). (B) MSL1, MSL2, MSL3, MLE, MOF and H4K16ac immunostaining on polytene chromosomes from wild type males, with X-chromosome targeting, and from roX mutant males, showing the 4th chromosome and chromocenter targeting. (C) JIL1 immunostaining on polytene chromosomes from wild type and roX mutants males, shows targeting to the chromocenter and to the same chromosome 4 bands as the MSL-complex. (D) Mean levels of mRNA from the six genes targeted by MSL in roX mutants and from a control gene on the 4th chromosome that is not bound by MSL (MED26), determined by rt-qPCR (black). The corresponding mean expression of the same genes in wild type is shown in grey. The mRNA levels measured by qPCR were normalized against RpL32 mRNA in each replicate. Error bars represent the standard deviation of three biological replicates.

