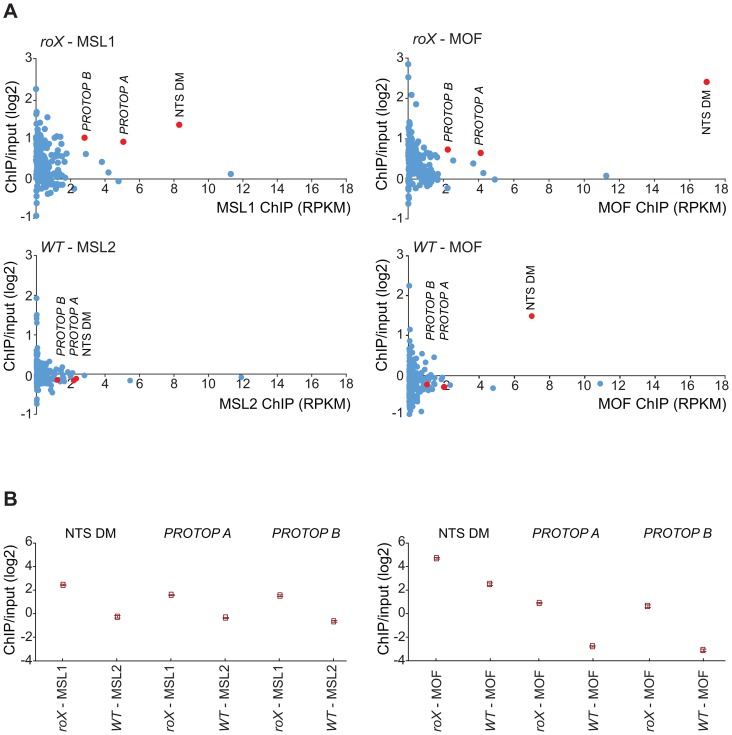
Figure 5. MSL-complex targets PROTOP and NTS in roX mutants.
(A) Reads from the ChIP samples mapped to repeat classes from Repbase Update are shown on the x-axis as RPKM values (Reads Per Kilobase per Million mapped reads) and related to ChIP/input enrichment ratios, which are shown on the y-axis. The left part shows MSL1 ChIP in roX mutants compared to MSL2 in wild type and the right part shows MOF ChIP in roX mutants and wild type. Note, that NTS is enriched also in MOF wild type. (B) Enrichment ratio (IP/input) of the overrepresented repeats from A (NTS, PROTOP_A, PROTOP_B) in roX mutants compared to the wild type. Rectangles represent the mean values of the IP/input enrichment ratios of all mapped and unmapped reads matching to each repeat type, and error bars indicate 95% confidence intervals.

