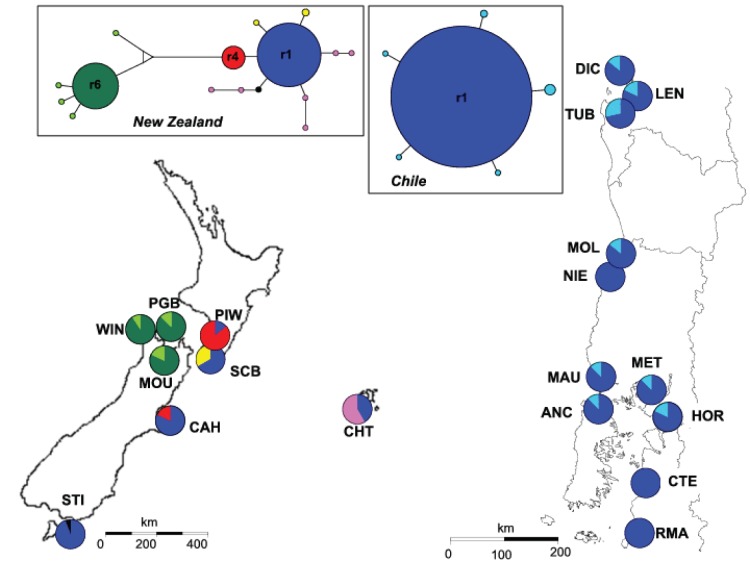
Figure 1. Location of the sampling sites.
ITS2 ribotype distribution and ITS2 network including 201 sequences of 481 nucleotides. Pie charts represent ribotype frequency in each population. Ribotype network was constructed using a median-joining algorithm with programme NETWORK [36]. Colours of the network correspond to those mapped with rare ribotypes in each “region” pooled under the same colour for clarity. Circle sizes are proportional to total ribotype frequency and connection lengths correspond to mutation steps (most of the ribotypes are separated by one mutational step but eight mutations separate r4 from r6).

