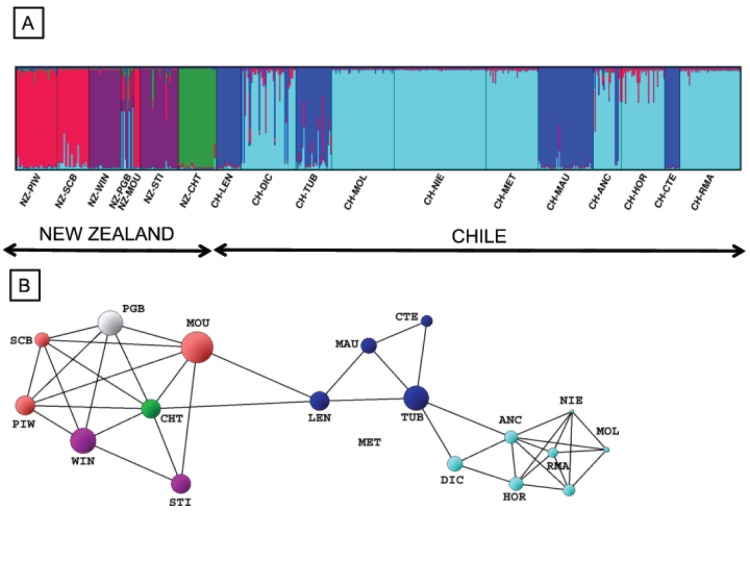
Figure 2. Genetic population structure of New Zealand and Chilean Gracilaria populations.
(A) based on Bayesian analysis with STRUCTURE software [37], proportions of individual multilocus genotypes were assigned to each of the 5 virtual genetic clusters indicated by the different colours; (B) based on graph analysis with POPULATION GRAPH software [40], differences in node size reflect differences in within population variability whereas edge lengths represent the genetic variation between pairs of samples, there were significantly more edges within New Zealand and Chilean groups than between the two groups (P<0.0001). Node colour corresponds to the 5 clusters as determined by STRUCTURE. For both analyses: N = 7 New Zealand populations, 11 Chilean populations, 567 individuals, 5 codominant loci. Population codes are provided in Table S1.

