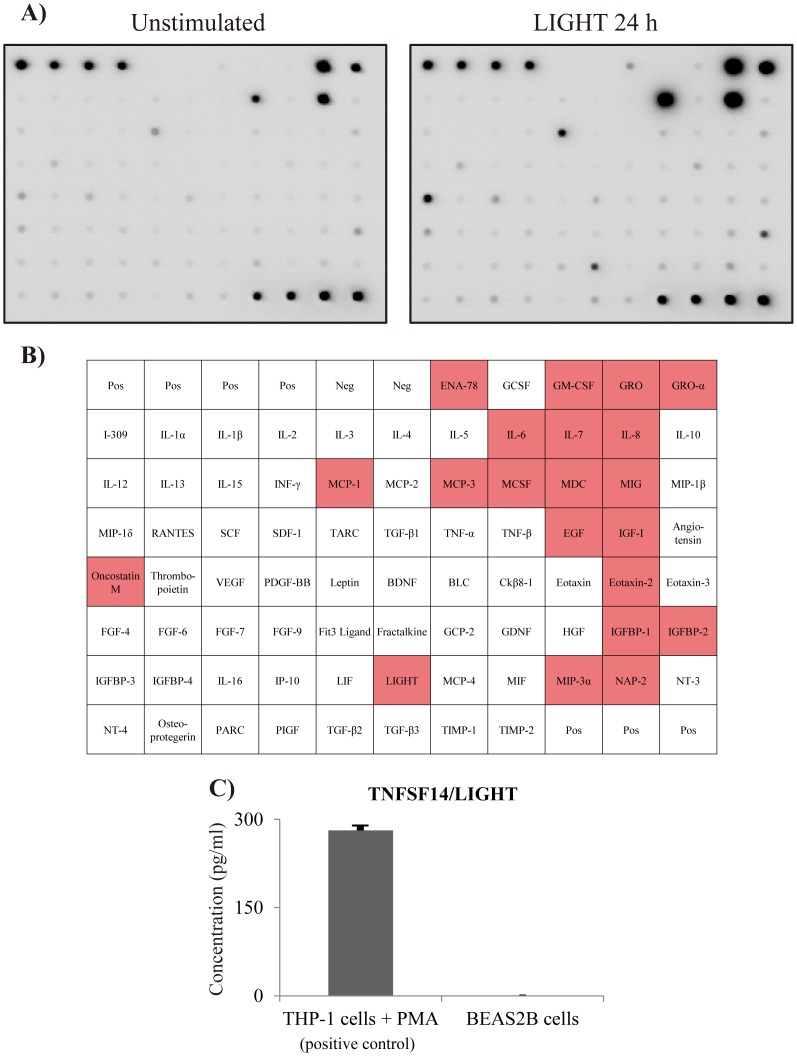
Figure 3. Comprehensive analysis of LIGHT-induced cytokine and chemokine production.
BEAS-2B cells were stimulated with LIGHT (100 ng/ml) for 24 h, followed by determination of the protein levels of cytokines and chemokines by densitometry using a cytokine array. (A) The left image shows the unstimulated samples, while the right image shows the samples at 24 h after stimulation with LIGHT. (B) This table shows array mapping. The red color indicates cytokines that were upregulated more than twofold compared to the unstimulated sample. LIGHT induced inflammatory cytokines, such as GRO, GRO-α, oncostatin M, MCP-1, IL-6 and IL-8. (C) We investigated whether BEAS-2B cells produced LIGHT. THP-1 cells, which were used as a positive control, produced LIGHT when stimulated with PMA 50 ng/ml, but BEAS-2B cells did not.

