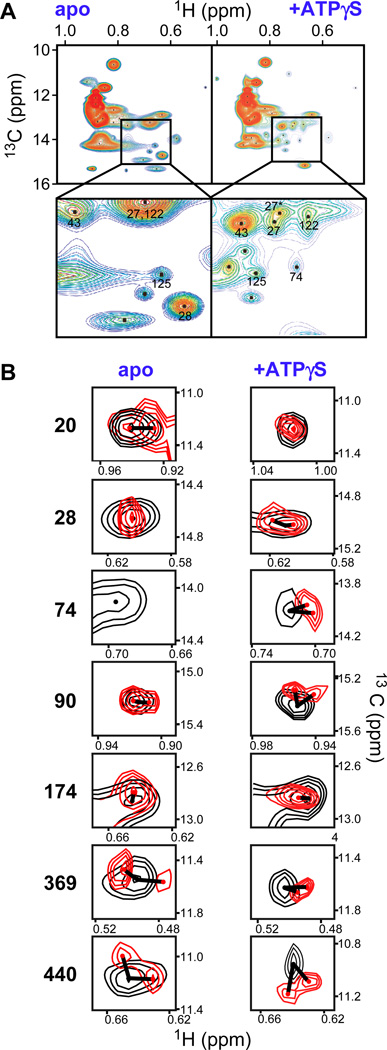
Fig. 2. Tau causes specific shift in Hsp90 NMR spectra.
A, ATP binding modulates the dynamics of the Hsp90-Tau complex. Rainbow representation of 1H-13C-Ile-methyl-TROSY cross-peaks of full-length Hsp90 in complex with Tau (left) and Tau+ATPγS (right). The inset magnifies peaks that sharpen upon ATPγS binding, numbers indicate assigned isoleucines (numbering without N-terminal methionine). B, Tau binding causes shifts and peak doubling in Hsp90 spectra (Hsp90, 125 µM; Tau, 287 µM; Hsp90, black; Hsp90+Tau, red), in the absence and presence of ATPγS (2 mM). The extent of each shift is indicated by a line. See also Fig. S1 and Table S1.

