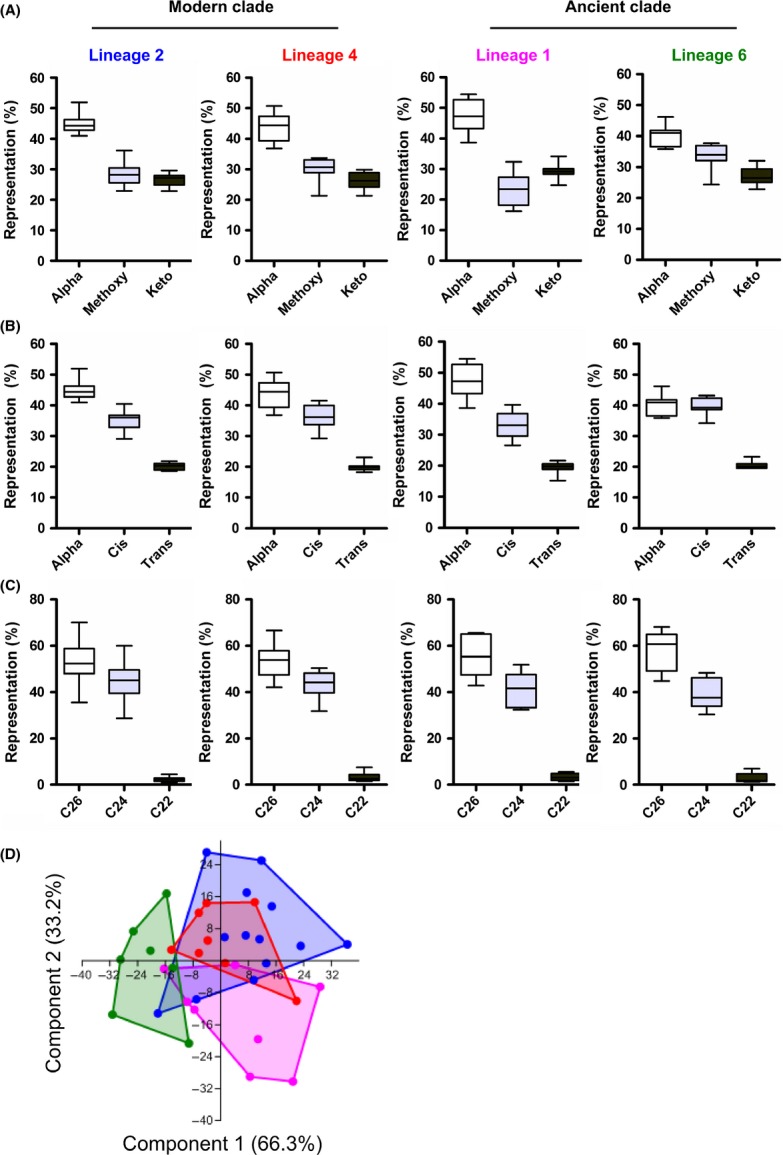
Figure 4.

Mycolic acid profiling of the different Mycobacterium tuberculosis complex (MTBC lineages. (A) Representation of alpha-, methoxy- and keto-mycolic acids (MAs) across the different MTBC lineages. (B) Representation of alpha-, cis- and trans-isomers of oxygenated MAs across the different MTBC lineages. (C) Representation of MAs species classified according to the length of the fatty acid chain in alpha of the meromycolic acid chain (“alpha-branch”) across the different MTBC lineages. (D) Scatterplot derived from principal component analysis of strain-specific mycolic acid profiles, showing that component one and component two covering 99.5% of sample variance discriminate Lineages 1 and 6, respectively, whereas “modern” Lineages 2 and 4 mostly overlap with each other.
