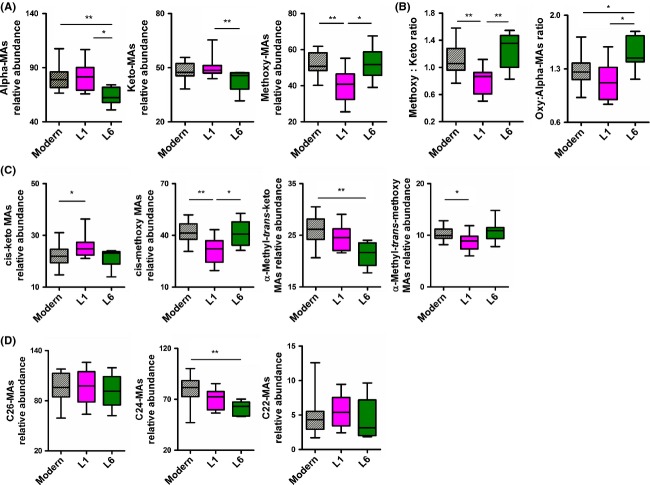
Figure 5.
Profiling of mycolic acid (MA) species, isomers and alpha-branch length across the different Mycobacterium tuberculosis complex (MTBC) lineages. (A) Relative quantification of alpha-, keto- and methoxy-MA species between “modern”, Lineage 1 (L1) and 6 (L6) of MTBC. (B) Comparison across the different MTBC lineages of the ratio of methoxy- to keto-MAs and the ratio of oxygenated (e.g., methoxy-MAs plus keto-MAs) to alpha-MAs. (C) Relative quantification of cis and alpha-methyl-trans isomers within keto-MAs and methoxy-MAs across the different MTBC lineages. (D) Relative quantification of MAs species classified according to the length of the α-branch MAs and across the different MTBC lineages (two-tailed Mann–Whitney test, *P < 0.05, **P < 0.01).

