
Fig. 2.
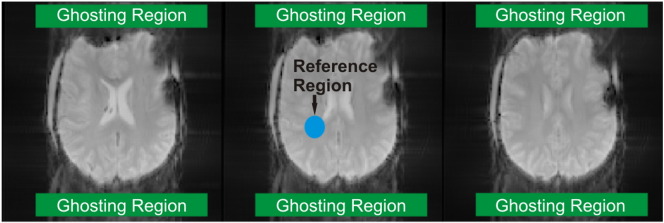
EPI images for visualizing of ghosting artifacts (P7, 7 T data). Green: ROIs for detection of ghosting signals, blue: central reference ROI. The relation between the mean absolute signals within the ghosting ROIs and the reference ROIs was calculated.