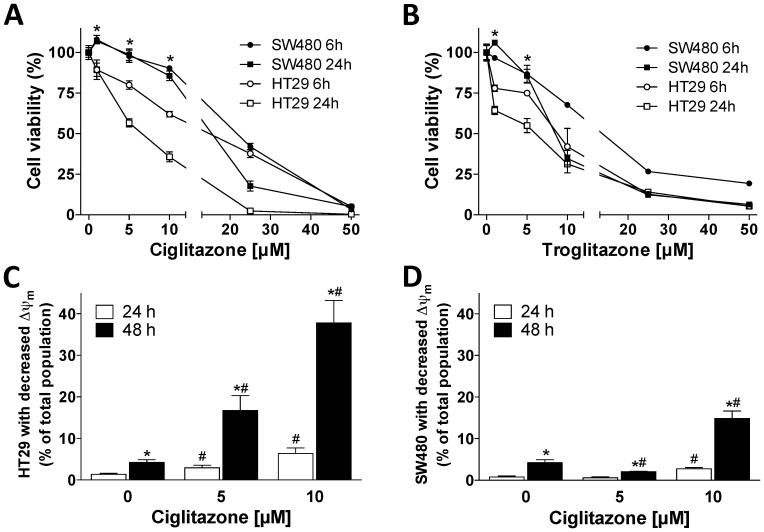
Figure 1. Cell viability and mitochondrial membrane potential after treatment with thiazolidinediones.
Cell viability was assessed by neutral red uptake in SW480 and HT29 cells treated with increasing concentrations of (A) Ciglitazone or (B) Troglitazone for 6 and 24 hours. *p<0.05, values of HT29 cells differ from those of SW480 cells. Mitochondrial membrane potential (Δψm) was assessed by JC-1 FACS analysis in (C) HT29 and (D) SW480 cells treated with increasing concentrations of Ciglitazone for 24 and 48 hours. *p<0.05, values at 48 hours differ from those at 24 hours. #p<0.05, values at indicated concentrations differ from baseline.

