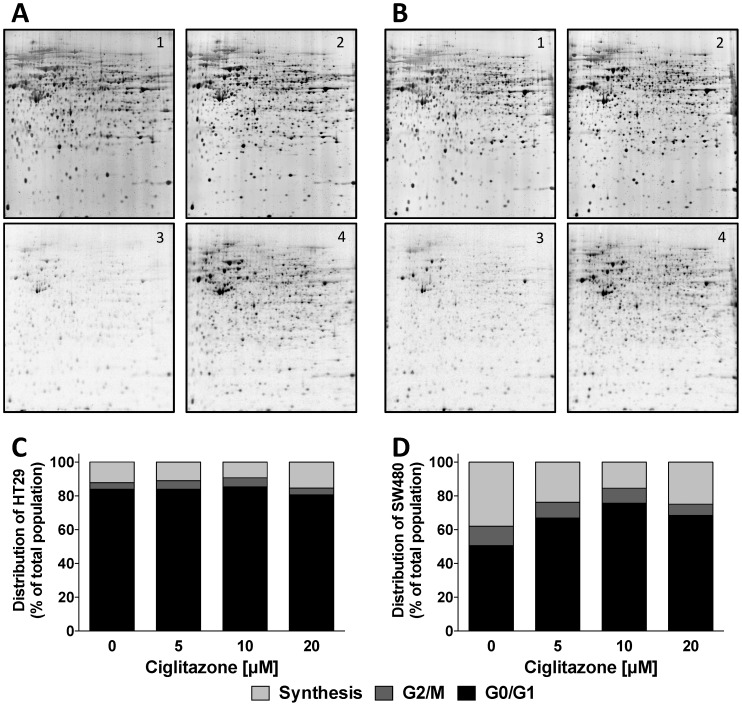
Figure 3. Cell responsiveness of colorectal adenocarcinoma cell lines after treatment with Ciglitazone.
2D-PAGE gels were performed in (A) HT29 and (B) SW480 cells after treatment with 5 µM Ciglitazone. (1) Fluorescence scans of untreated cells, (2) fluorescence scans of cells treated with Ciglitazone, (3) autoradiography scans of untreated cells, (4) autoradiography scans of cells treated with Ciglitazone. Cell cycle distribution of (C) HT29 and (D) SW480 cells treated with increasing concentrations of Ciglitazone.

