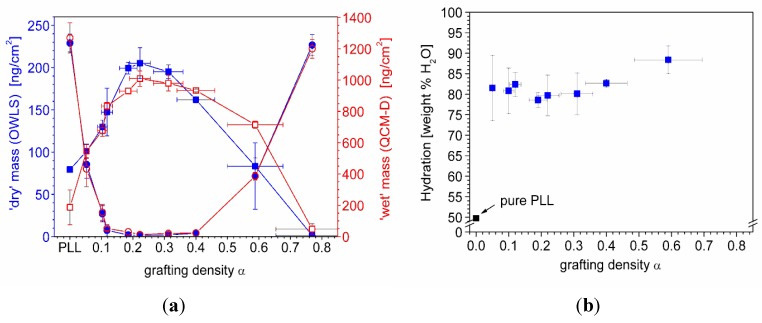
Figure 6.
(a) Comparison of ‘dry’ mass of adsorbed copolymer ( ) and serum proteins (
 ) as obtained from OWLS measurements (see Figure 5(a)) and ‘wet’ mass of adsorbed copolymer (
 ) and serum proteins (
 ) as obtained from QCM-D measurements using Voigt modelling (see Figure 5(b)) for PLL-g-PMOXA graft copolymers of varying graft density. α = 0 corresponds to pure PLL. Copolymer and serum adsorbed masses were taken after rinsing with buffer after a stable value was reached; (b) Hydration in weight percent of water in the PLL-g-PMOXA adlayers calculated from the data in (a) according to Equation (4).

