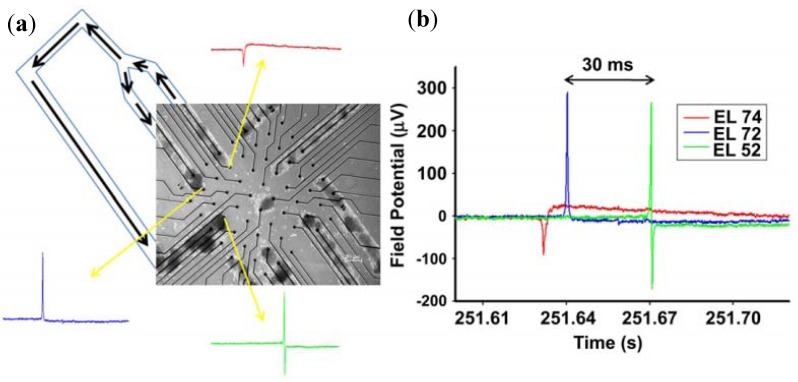
Figure 10.
AP conduction in patterned cardiac myocyte monolayers. (a) Phase contrast picture of cardiac myocyte patterns on the top of the substrate embedded electrodes (electrode distance is 200 μm) with a sketch of the conduction pathway on the completed pattern and with the recorded extracellular signals on the given electrodes; (b) Overlay of the recorded traces showing the temporal relationship of the signals. (Reprinted from [53]. © 2011, with permission from Elsevier).

