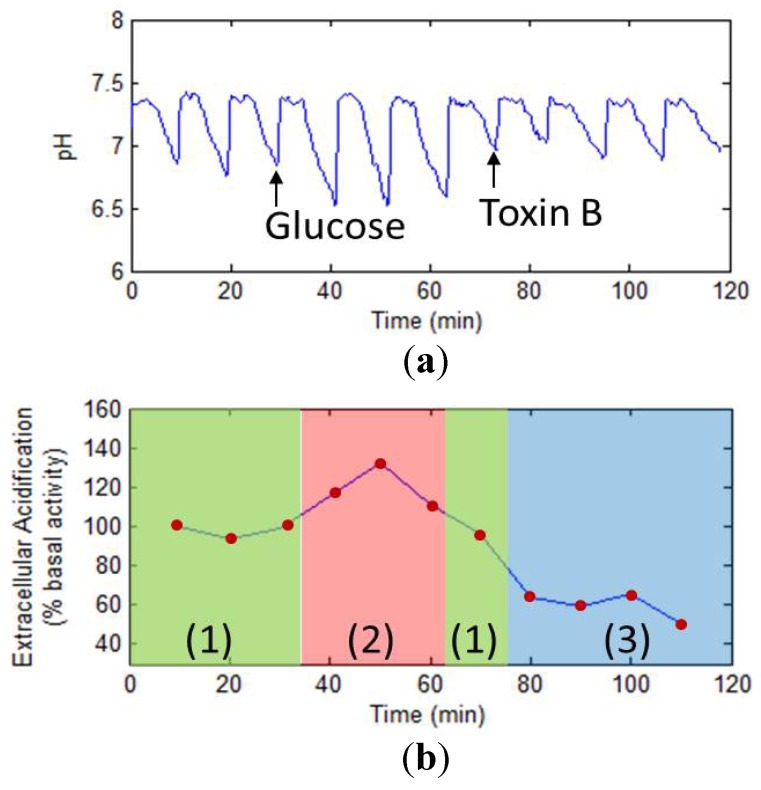
Figure 22.
Cellular metabolism detection under drug stimulation. (a) Original data shows the change of pH corresponding to the photocurrent; (b) The extracellular acidification rate under the blank (1), glucose (2) and clostridium difficile toxin B (3). (Reprinted from [111]. © 2012, with permission from World Scientific Publishing Co.)

