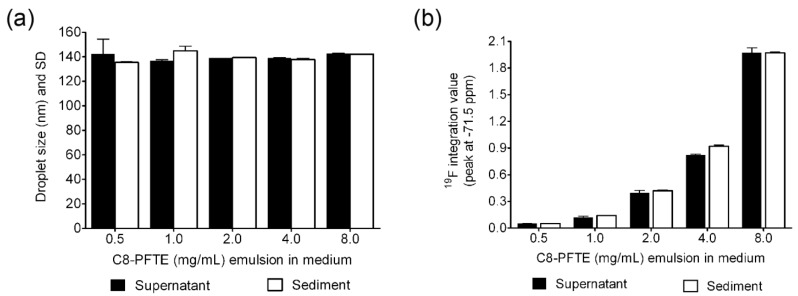
Figure 8.
(a) Graph showing droplet diameter before and after centrifugation of nanoemulsion M2 in cell-exposed nanoemulsion dispersed medium. (b) Integrated values of C8-PFTE 19F resonance peak in the supernatant and sediment of cell-exposed nanoemulsion dispersed medium. Error bars are standard deviation from mean of duplicate experiments.

