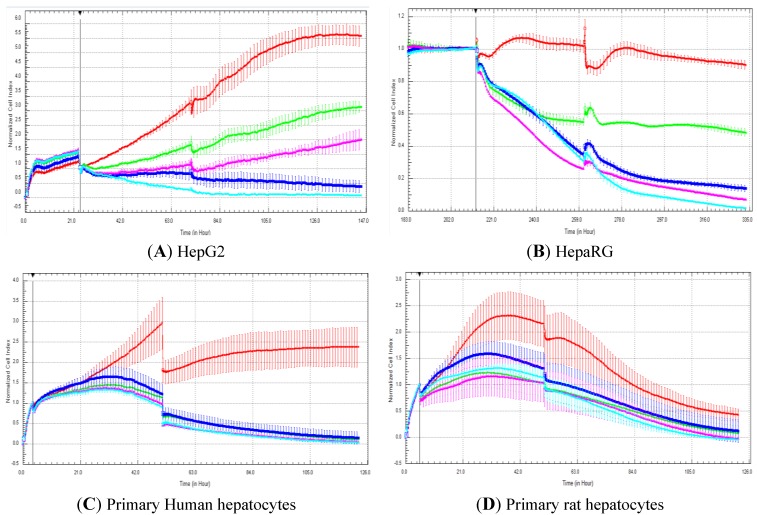
Figure 2.
RTCA profiles generated in HepG2, cryopreserved HepaRG, primary rat and human hepatocytes exposed to cerivastatin. Cellular models as indicated in the panels A, B, C and D. Cells were exposed to: 0 (0.5% DMSO, red curve), 33 (green curve), 66 (purple curve), 132 (dark blue curve) and 264 (light blue curve) µM cerivastatin for five days. The concentration tested were multiple of the Cmax value (Cmax cerivastatin = 2.64 µM), i.e., 12.5, 25, 50 and 100 Cmax. Cerivastatin was added on day 0 (close to the vertical line) and day two. Cell indexes were normalized with the last time point before compound addition. The normalized time point is indicated by the vertical line. Each data point was calculated from triplicate values (except for control cells n = 6). Data represent the average ± standard deviation. For more details, please refer to the Materials and Methods section.

