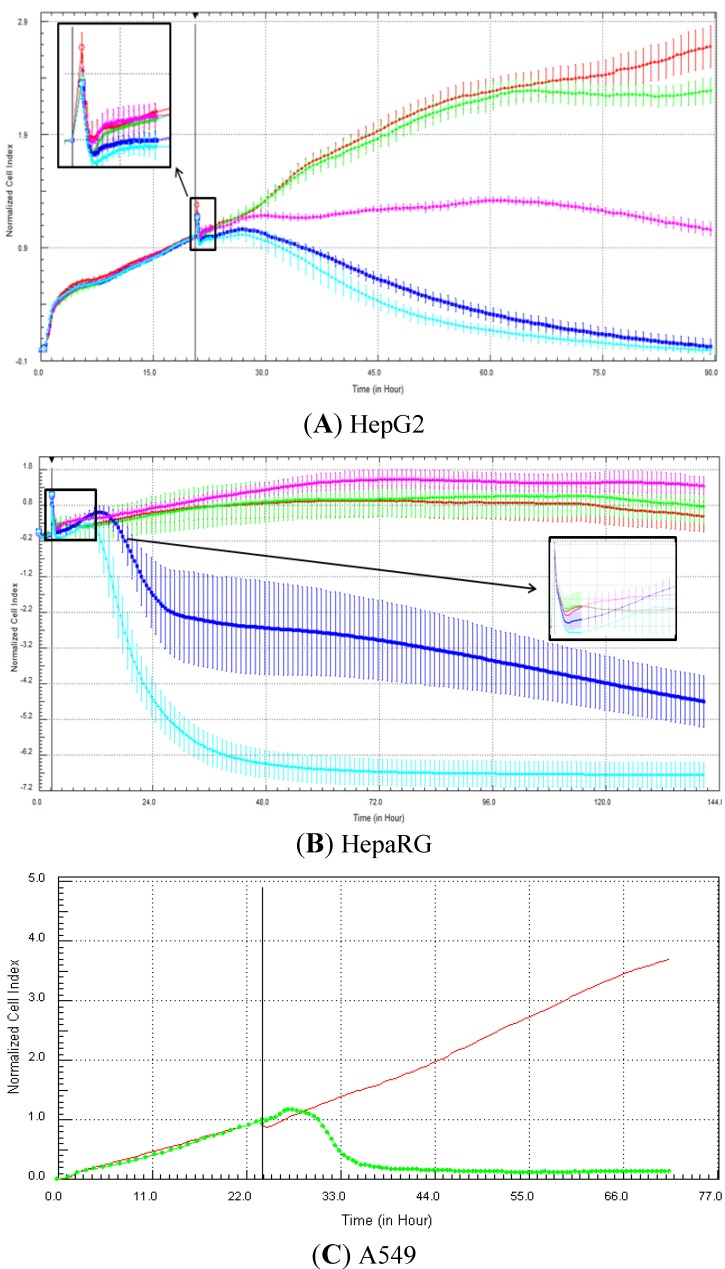
Figure 5.
Effect of strophanthidin (DNA damaging) on cell index curves (RTCA) in HepG2, fresh HepaRG and A549 cells. HepG2 (A) and HepaRG (B) cells were exposed for at least 72 h to 0 (0.5% DMSO, red curve), 0.1 (green curve), 1 (purple curve), 10 (dark blue curve) and 100 (light blue curve) µM and A549 cells to 0 (control DMSO, red curve) and 20 µM (green curve) of nocodazole (C from Abassi et al. [9]). Cell indexes were normalized with the last time point before compound addition. Panels A and B: each data point was calculated from triplicate values (except for control cells n = 6). Data represent average ± standard deviation (except for panel C). The normalized time point is indicated by the vertical line. For more details, please refer to the Materials and Methods section. A zoom is provided in case of overlapping curves.

