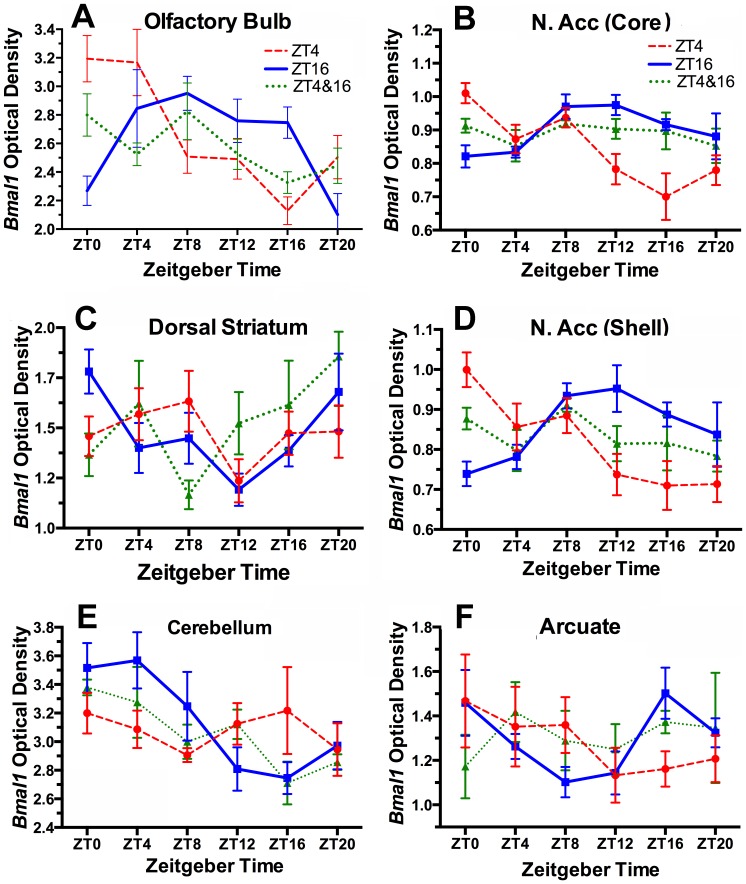
Figure 5. Group mean (± SEM) optical densities representing Bmal1 mRNA from rats fed 2 h daily at ZT4 (red dashed curve) or ZT16 (blue solid curve), or for 1 h at both times (green dotted curve).
A. Olfactory bulb, B. nucleus accumbens core, C. dorsal striatum, ventrolateral quadrant, D. nucleus accumbens shell, E. cerebellum, F. Arcuate nucleus.

