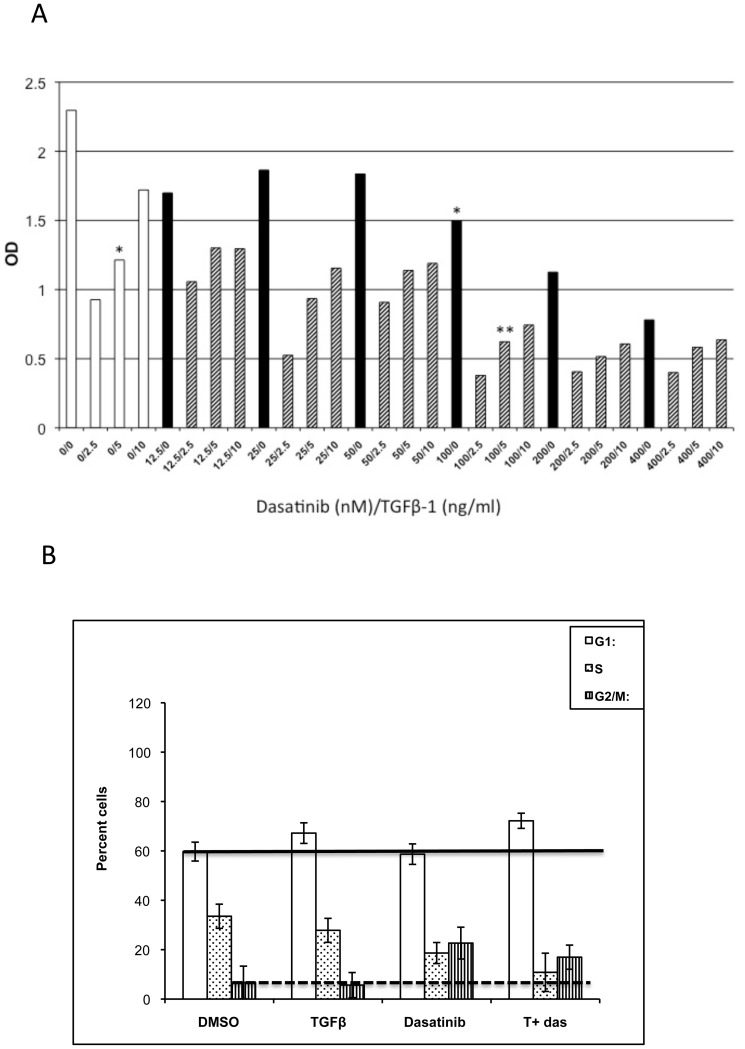
Figure 2. Inhibition of cell growth of A549 cells treated with TGFβ-1 and dasatinib.
(A) A549 cells were treated with DMSO, different concentrations of TGFβ-1 (0–10 ng/mL; white bars), different concentrations of dasatinib (0–400 nM; black bars), or a combination of TGFβ-1 and dasatinib (dashed bars) for 48 hours. Treatment of cells with both agents resulted in increase inhibition (**), as compared to when cells were treated with either agent alone (*). (B) A549 cells were treated with DMSO, 5 ng/mL TGFβ-1, 100 nM dasatinib, or a combination of 5 ng/mL TGFβ-1 and 100 nM dasatinib for 48 hours. After 48 hours, propidium iodide stained cells were analyzed to determine cell cycle distribution and analyzed as described in Materials and Methods.

