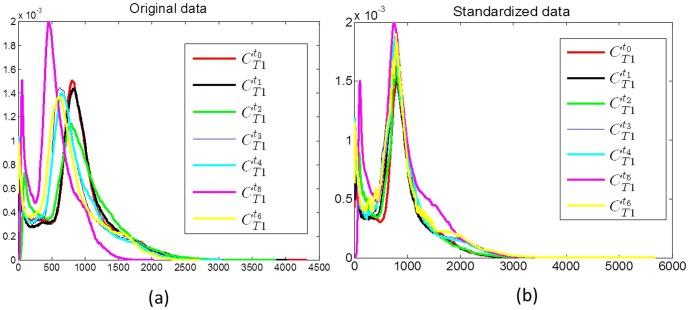
Figure 3. Illustration of intensity drift between pre- (red) and post-LITT at different time points (shown in blue, green, yellow, magenta, and cyan) for T1w MRI, by plotting the corresponding distributions along the same axis.
Note that after intensity standardization, the distributions across different time-points are no longer misaligned, suggesting successful correction of the drift artifact.

