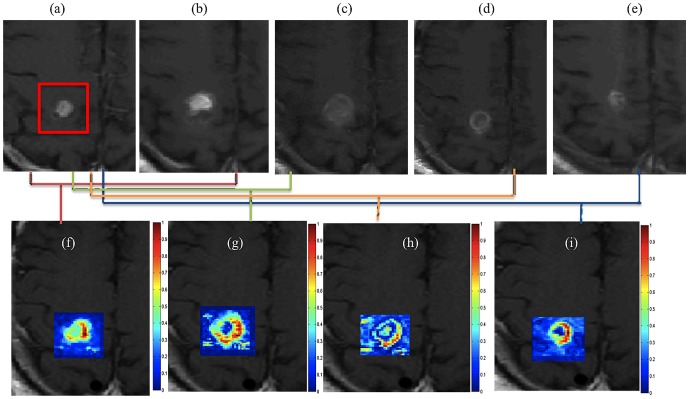
Figure 6. Original T2-w MRI images for (a) baseline (pre-LITT), (b) 24-hour, (c) 1-month, (d) 3-month, (e) 6 month post-LITT.
Figs. 6(f)  , (g)
, (g)  , (h)
, (h)  , and (i)
  correspond to difference maps for T2-w MRI acquired at each of
  ,
,  ,
,  , and
, and  with respect to
  . Fig. 6(j) shows temporal profiles of every MR protocol
  ,
,  , reflecting the changes in imaging markers at different time-points with respect to baseline scan.

