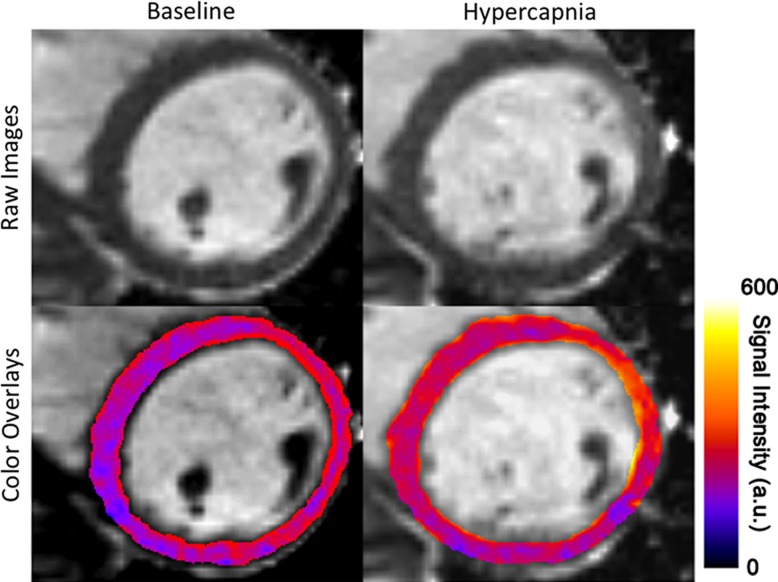
Figure 1a:
Effect of changing arterial carbon dioxide on myocardial BOLD MR signal intensities in healthy humans. (a) Representative short-axis myocardial BOLD MR images collected from a volunteer at baseline (PetCO2 = 37 mm Hg) and hypercapnia (PetCO2 = 47 mm Hg). BOLD signal intensity increased during hypercapnia. For ease of visualization, color overlays of the left ventricle (with color bar showing BOLD signal intensity in arbitrary units [a.u.]) that correspond to the gray-scale images are shown directly below. (b) Box and whisker plot shows the dependence of percentage of hyperemic BOLD response on PetCO2, and standard dose of adenosine. Percentage of hyperemic response increased at higher PetCO2 values; response at +10 mm Hg (Plus10) did not differ from that of standard adenosine infusion. Percentage of hyperemic BOLD response for adenosine is from reported values in the literature (14). * = significant difference relative to resting (Rest) (P < .05). Top and bottom of boxes indicate upper limit, +1 standard deviation, and lower limit, −1 standard deviation, respectively; error bars (whiskers) are maximum and minimum of data. The mean and median are represented as a point and a band within the box, respectively. For adenosine, the whiskers represent the boundaries of first and 99th percentile of the data.

