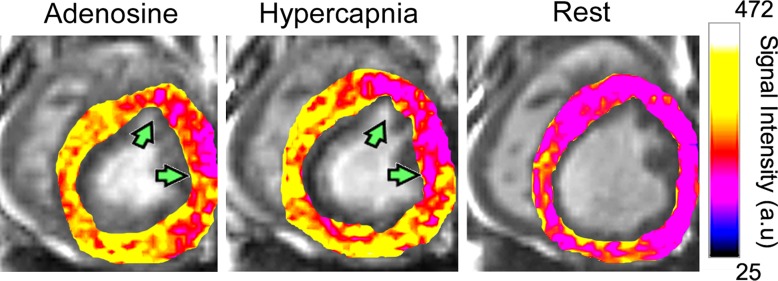
Figure 3a:
BOLD response to adenosine versus hypercapnia in the presence of LAD stenosis in canines. (a) Representative color-overlaid BOLD MR images acquired during adenosine infusion, hypercapnia, and rest from a canine with LAD stenosis (arrows). Color bar shows myocardial BOLD MR signal intensity. Images acquired under adenosine infusion and at rest were obtained under normocapnia. (b) Bull’s eye plots constructed from images in panel a; the raw rest image with segmentation details is shown for reference. The point of radial extension on the epicardial contour of the bull’s eye plots and rest BOLD MR image indicates the right-ventricular insertion point. Color base is shown to index the magnitude of the BOLD response between rest and stress. Note the close correspondence in hypoperfused territories between hypercapnia and adenosine (arrows, a) and the normalized BOLD response of myocardial segments at both hyperemic states (adenosine and hypercapnia) relative to resting state in panel b. (c) Box plot shows percentage of hyperemic BOLD response from stenosis (affected) and remote (unaffected) segments in the presence of LAD stenosis in canines. Box plot presentation is the same as before. * = significant difference relative to affected territories (P < .05). Actual values in panel c are as follows: for adenosine, 1.01 ± 0.04 affected segments and 1.06 ± 0.04 unaffected segments; and for hypercapnia, 0.94 ± 0.04 affected segments and 1.04 ± 0.04 unaffected segments.

