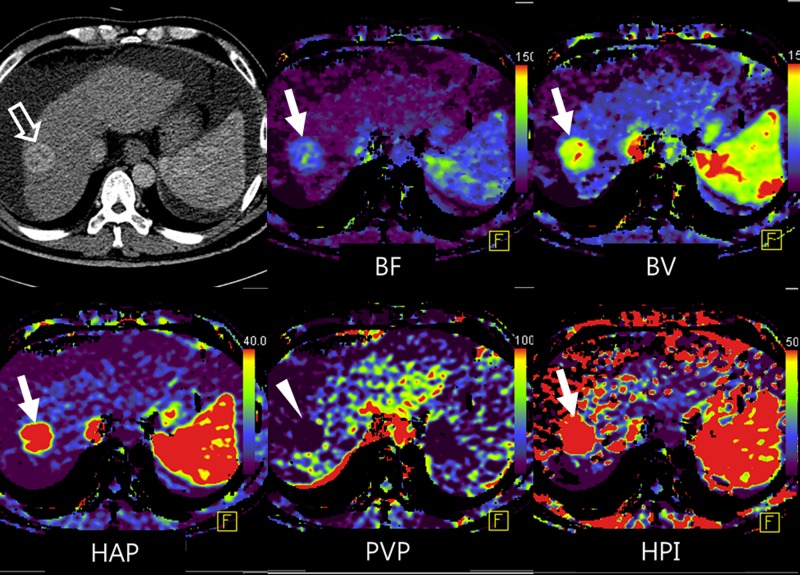
Figure 5a:
Representative example of HCC shows typical findings at perfusion CT. (a) Arterial phase image (top left) shows 3.2-cm hyperenhancing mass (open arrow) in segment VIII of liver. Color-coded CT perfusion maps show increased blood flow (BF) (top middle), blood volume (BV) (top right), HAP (bottom left), and HPI (bottom right) of tumor (solid arrows) compared with adjacent normal hepatic parenchyma. Note marked decrease in PVP of tumor (arrowhead, bottom middle). (b) Photograph of gross specimen after liver transplantation confirms encapsulated, well-differentiated HCC (arrows). (Image courtesy of J. M. Lee.)

