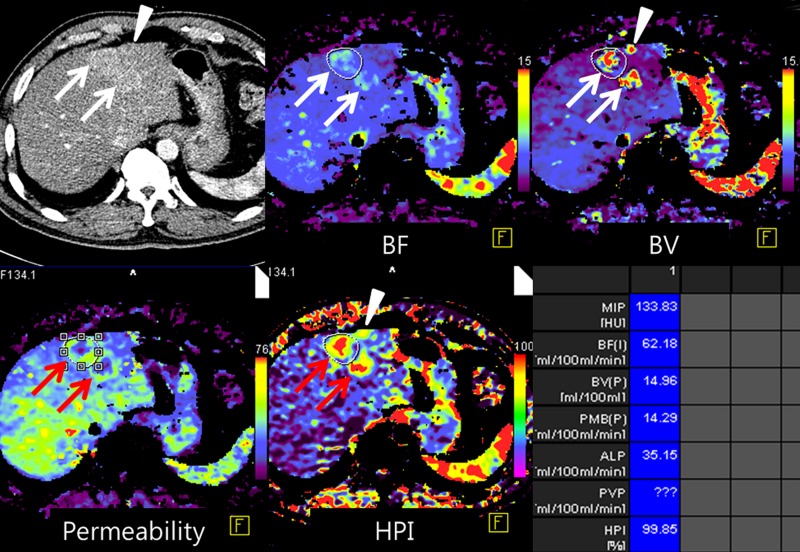
Figure 7a:
Images show perfusion CT improving detection of liver metastases from rectal cancer and identifying early treatment response after chemotherapy. (a) On arterial phase CT image (top left), two ill-defined, enhancing lesions (arrows) are in the left hepatic lobe. On color-coded CT perfusion maps, both metastases (arrows) show increased blood flow (BF) (top middle), blood volume (BV) (top right), permeability (bottom right), and HPI (bottom right) compared with adjacent normal hepatic parenchyma. Note, additional tiny metastatic focus (arrowhead) is clearly visualized on perfusion maps with increased blood volume and HPI but not well visualized on arterial phase CT image (top left). (b) CT perfusion images obtained after one cycle of chemotherapy show marked decrease in blood flow, blood volume, and HPI of the tumor (arrow). (c) PET/CT image before chemotherapy shows strong FDG uptake in both dominant metastases (arrows). Posttreatment PET/CT image (one cycle) also showed marked decrease of FDG uptake, indicating good treatment response.

