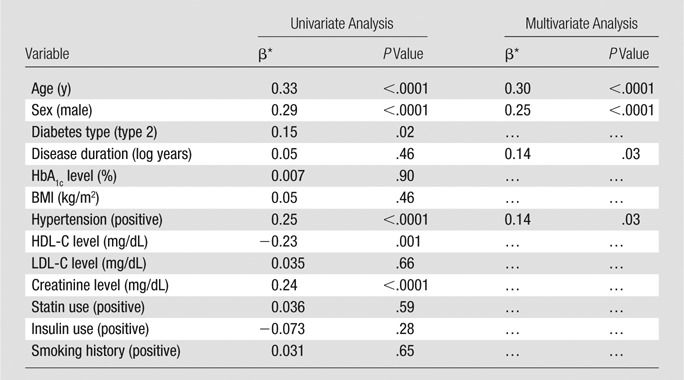
Table 3.
Univariate and Multivariate Predictors of CAC Score

Note.—The CAC score was log+1 transformed. Standard deviations for the variables are as follows: age = 8.0 years, HbA1c level = 1.2%, BMI = 5.9 kg/m2, HDL-C level = 11.5 mg/dL, LDL-C level = 22.0 mg/dL, creatinine level = 0.2 mg/dL, disease duration = 0.7 log year. The R2 for the multivariable model was 0.18.
Data are standardized β coefficients.
