
Figure 10a:
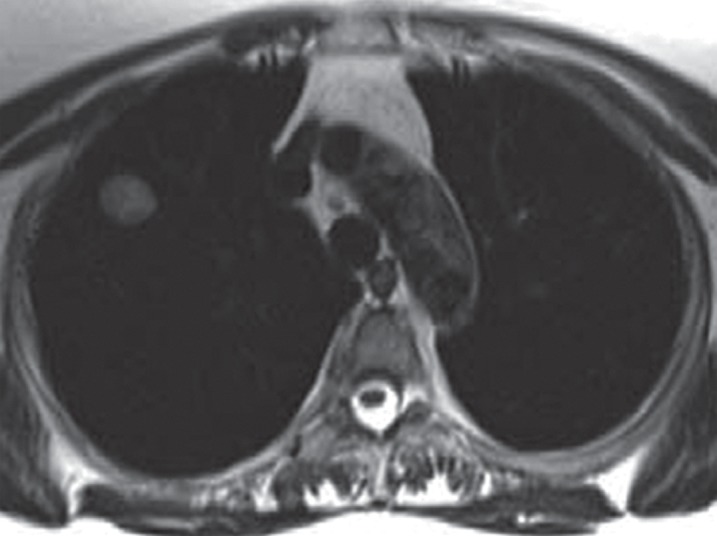
Images in a 65-year-old man with right upper lobe adenocarcinoma, with tracer transport rate constant (kep) of 3.2 min−1. (a) Axial T2-weighted half-Fourier acquisition single-shot turbo spin-echo MR image (pulse repetition time msec/echo time msec = 1200/100; field of view [FOV] = 400 mm; 320 × 320; one signal acquired; bandwidth [BW] = 780 kHz; flip angle [FA] = 150°; echo train length [ETL] = 256; 5.5-mm section thickness, 1.6-mm intersection gap; acquisition time = 6 min) and (b) postcontrast (gadopentetate dimeglumine 0.1 mmol/kg bolus injection) sagittal T1-weighted volumetric interpolated breath-hold examination MR image (3.4/1.3; FOV = 400 mm; 260 × 320; one signal acquired; BW = 505 kHz; FA = 10°; 4-mm section thickness, 0-mm intersection gap; acquisition time = 1.7 min) demonstrate right upper lobe lesion representing adenocarcinoma. (c) Representative parametric maps of tumor area on T1-weighted MR image (500/1.6, FOV = 400 mm, 192 × 180, one signal acquired, BW = 360 kHz, FA = 10°, 5-mm section thickness, oblique sagittal orientation, 124 frames, 2 seconds per frame, acquisition time = 4 min, gadopentetate dimeglumine 0.1 mmol/kg intravenously). Left panel: Goodness-of-fit map color-coded according to confidence level of χ2 test overlaid on T1-weighted image. Middle panel: Boundaries of voxels with more than 50% confidence level of χ2 test are superimposed on T1-weighted image. Right panel: Color-coded kep map. The map shows kep values of the entire tumor area. The kep values within the boundaries of the middle panel were used for the evaluation. The isolated voxel at the edge of the tumor is a single voxel. (Reprinted, with permission, from reference 75.)