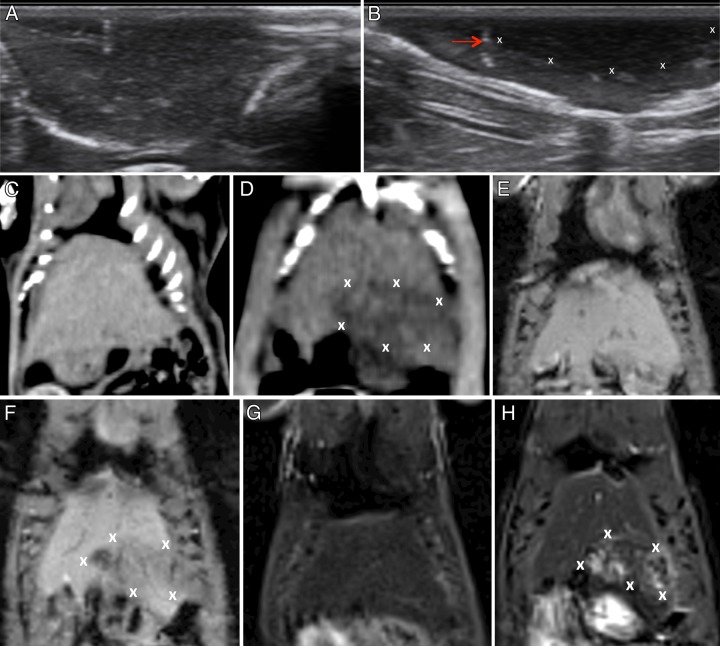
Figure 1:
Representative images acquired before and after IRE in normal hepatic parenchyma. A, Pre-IRE US image shows normal liver parenchyma. B, Post-IRE US image shows a hypoechoic region (X) in the liver parenchyma and represents the ablation zone. Arrow = IRE probe position (hyperechogenicity related to introduction of air at probe placement). C, Pre-IRE CT image shows normal liver parenchyma. D, Post-IRE CT image shows ablation zones as areas of hypoattenuation (X). E, Pre-IRE T1-weighted MR image shows normal liver parenchyma. F, T1-weighted MR image shows ablation zone as a hypointense region (X). G, Pre-IRE T2-weighted MR image shows normal liver parenchyma. H, T2-weighted MR image shows ablation zone as a hyperintense region (X).

