
Table 2.
Description of Study Participants according to Incident Event Status during Follow-up with Results Weighted to Reflect the Baseline MESA Cohort
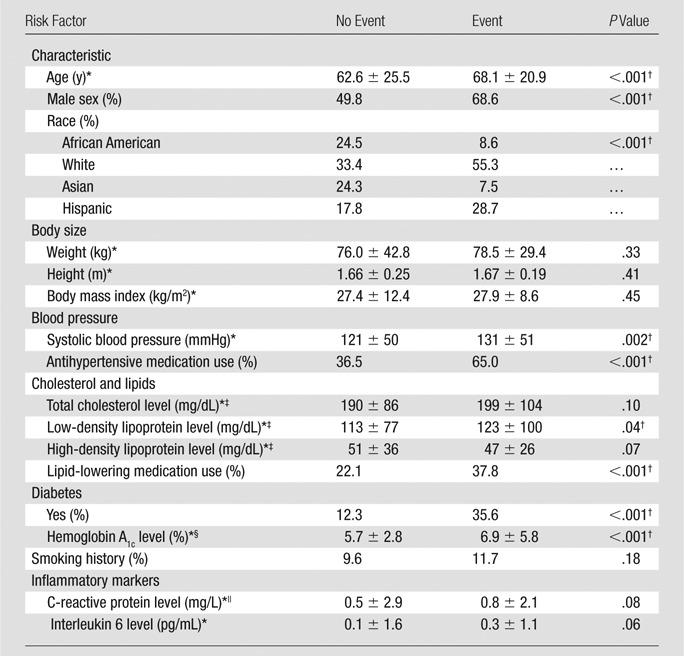
*
Data are mean ± standard deviation.
†
Difference was significant (P < .05).
‡
To convert to SI units (millimoles per liter), multiply by 0.0259.
§
To convert to SI units (proportion of total hemoglobin), multiply by 0.01.
||
To convert to SI units (nanomoles per liter), multiply by 9.524.