
Figure 2a:
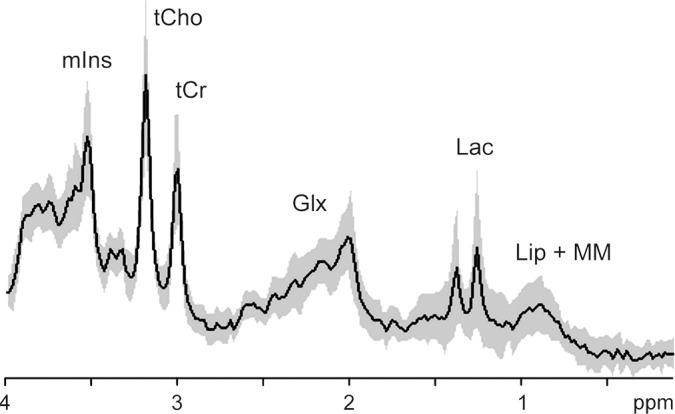
MR spectroscopy of astrocytomas. Average (solid line) and standard deviation (shaded area) 1H MR spectra (1.5 T, STEAM or PRESS, 2000/30, 128–256 repetitions per spectrum included in average) in World Health Organization (a) grade II (n = 14) and (b) grade IV (n = 42) astrocytomas. Characteristically elevated tCho/tCr ratio and absence of tNAA is apparent in both tumor spectra compared with that from normal brain (see Fig 1). Lac in low-grade tumor may be the result of hypoxia and/or a metabolic shift toward glycolysis, as is commonplace in cancer. In high-grade tumor, large macromolecule (MM) and lipid (Lip) signals (at chemical shifts 2.0, 1.3, and 0.9 ppm) are associated with necrosis. Glx = combination of Glu and Gln. (Reprinted, with permission, from reference 49.)