
Figure 3a:
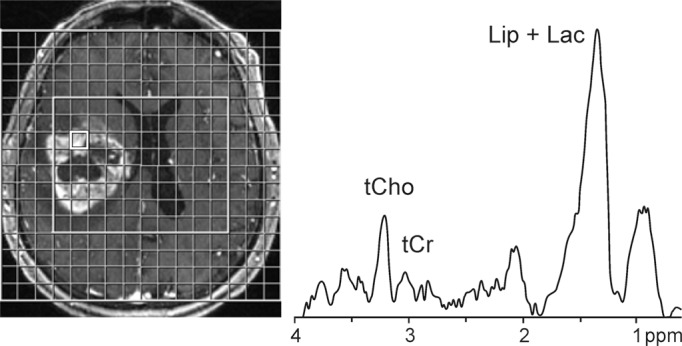
1H MR spectroscopy in glioblastomas. Contrast-enhanced T1-weighted MR images and MR spectroscopy grid (3.0 T, PRESS, 1700/30, three repetitions, section thickness = 20 mm, matrix size = 16 × 16, total acquisition time = 6 minutes 46 seconds) are shown together with representative spectra from voxels in contrast-enhancing areas. (a) Image and spectrum from patient with recurrent gliobastoma multiforme exhibits elevated tCho/tCr ratio as well as elevated lipid (Lip) and Lac levels. (b) Image and spectrum from histologically proven case of postradiation injury exhibits markedly elevated lipid (Lip) and Lac levels along with normal-appearing tCho/tCr ratio.