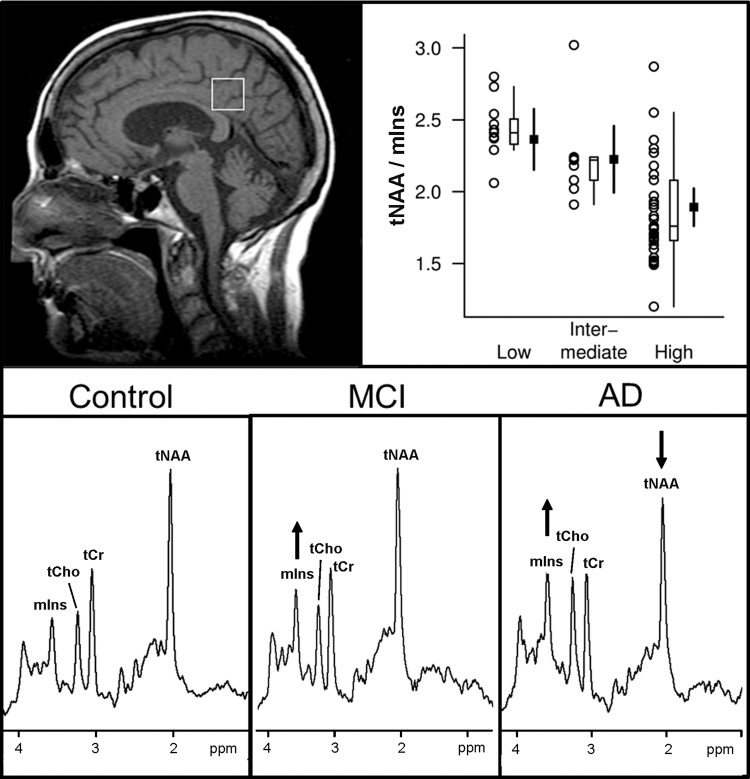
Figure 8:
1H MR spectroscopic findings at different pathologic and clinical stages of Alzheimer disease. Top panel: Antemortem 1H MR spectroscopic findings in posterior cingulate gyrus voxel (T1-weighted midsagittal image) are associated with postmortem pathologic diagnosis of Alzheimer disease (low, intermediate, and high likelihood). For each pathologic diagnosis, plot shows individual values, a box plot of the distribution, and estimated mean and 95% confidence interval for the mean. A strong association is observed with tNAA/mIns ratio (R2 = 0.40; P < .001). (Reprinted, with permission, from reference 33.) Bottom panel: Examples of 1H MR spectra (1.5 T, PRESS, 2000/30, 128 repetitions) in patients with mild cognitive impairment (MCI) and Alzheimer disease (AD) are compared with that from a cognitively normal subject (control). mIns is elevated as an early marker of subsequent neurodegenerative changes in patient with mild cognitive impairment. tNAA is decreased and mIns is further elevated in patient with Alzheimer disease.

