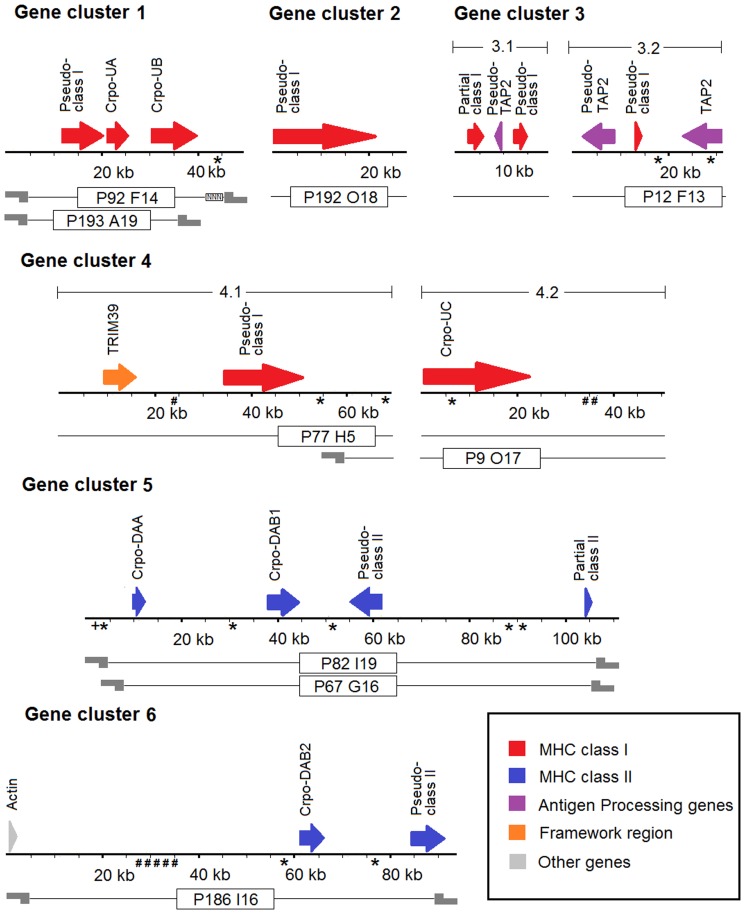
Figure 1. Schematic diagram of six saltwater crocodile gene clusters representing MHC class I and II.
Arrows indicate annotated genes and their strands (plus and minus); lines with names in the boxes below the annotation indicate BAC clones corresponding to the MHC gene clusters; and sticky ends show restriction sites of Hind III enzyme, and therefore BAC end sequencing. For retrotransposon sequences and endogenous retrovirus (ERV) sequences, asterisks indicate retrotransposon reverse transcriptase (RT) proteins; hashes indicate Gag-Pol precursor polyproteins; and pluses indicate non-LTR retrotransposon LINE-1 (L1).

