
Figure 1.
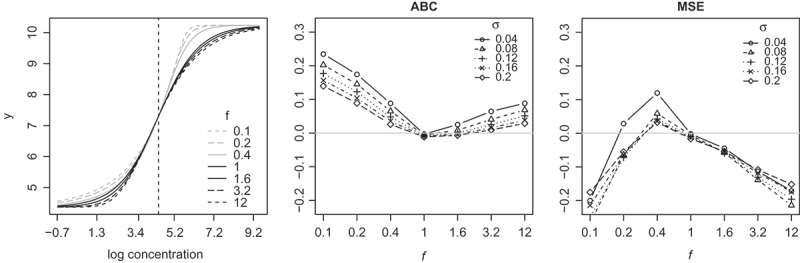
Left: Seven logistic curves studied in Section 2. The vertical line intersects each curve at the mid-point. Middle and right: Differences in ABC and MSE (4PL–5PL) as a function of f and σ. Positive values are in favor of 5PL.
Official websites use .gov
A
.gov website belongs to an official
government organization in the United States.
Secure .gov websites use HTTPS
A lock (
) or https:// means you've safely
connected to the .gov website. Share sensitive
information only on official, secure websites.
Left: Seven logistic curves studied in Section 2. The vertical line intersects each curve at the mid-point. Middle and right: Differences in ABC and MSE (4PL–5PL) as a function of f and σ. Positive values are in favor of 5PL.