
Figure 3.
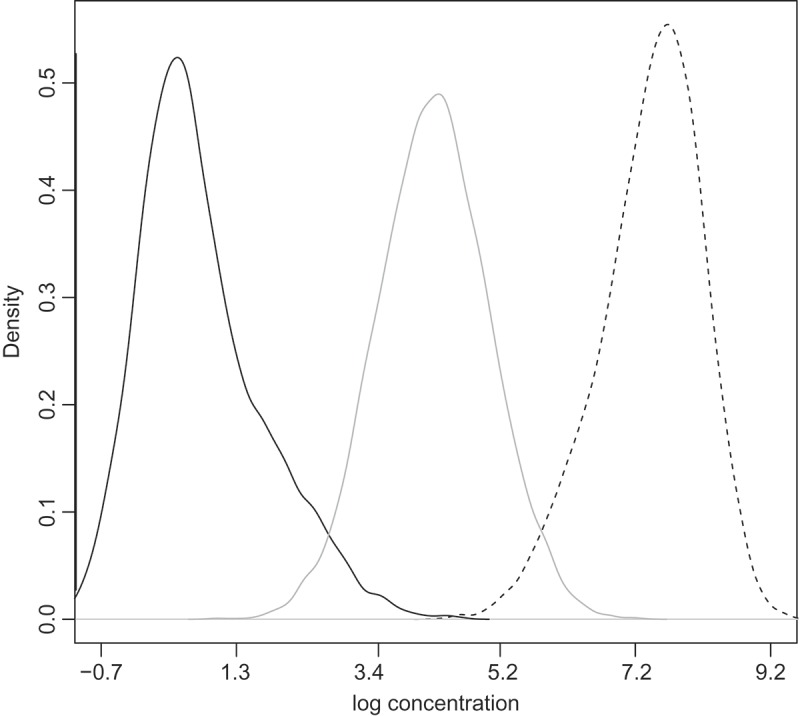
Three predictor distributions in Section 3. The mixture components of the predictor distributions: N (0.3, 0.5) and N (1.3,1) for low (solid black line), N (4,0.8) and N (4.4, 0.8) for medium (solid gray line), and N (7.8, 0.5) and N (7, 0.8) for high (solid dashed line).