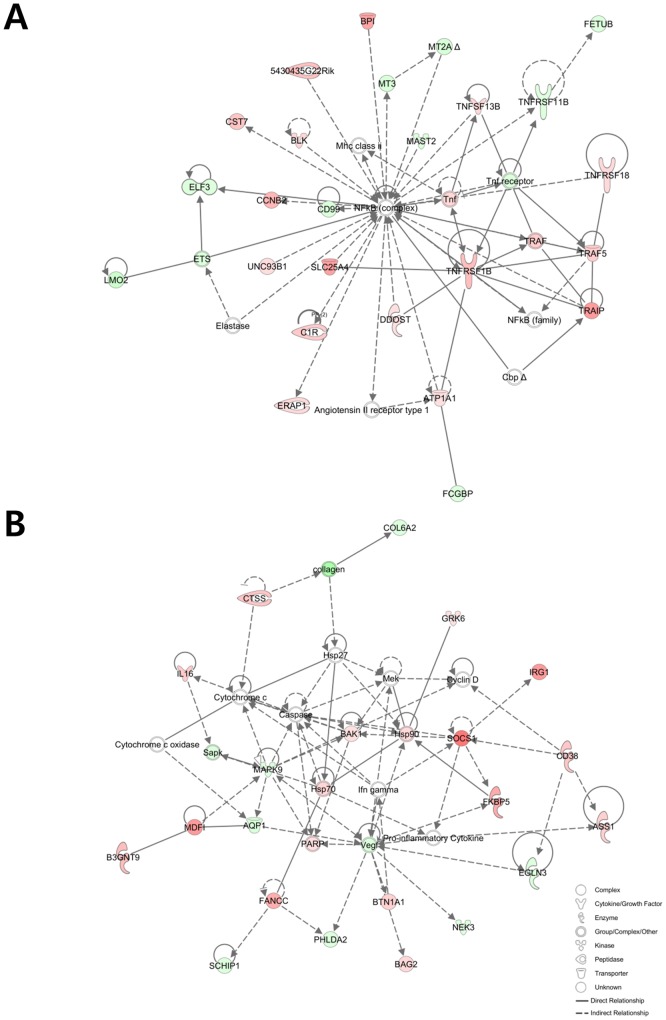
Figure 2. The first (A) and seventh (B) networks of genes most significantly associated with the differentially expressed transcripts in C. perfringens/E. maxima co-infected Ross chickens compared with uninfected controls.
Up- and down-regulated genes are illustrated by red and green, respectively. The color intensity directly correlates with the difference in the expression level of the corresponding gene compared between line 6 and line 7 chickens.

