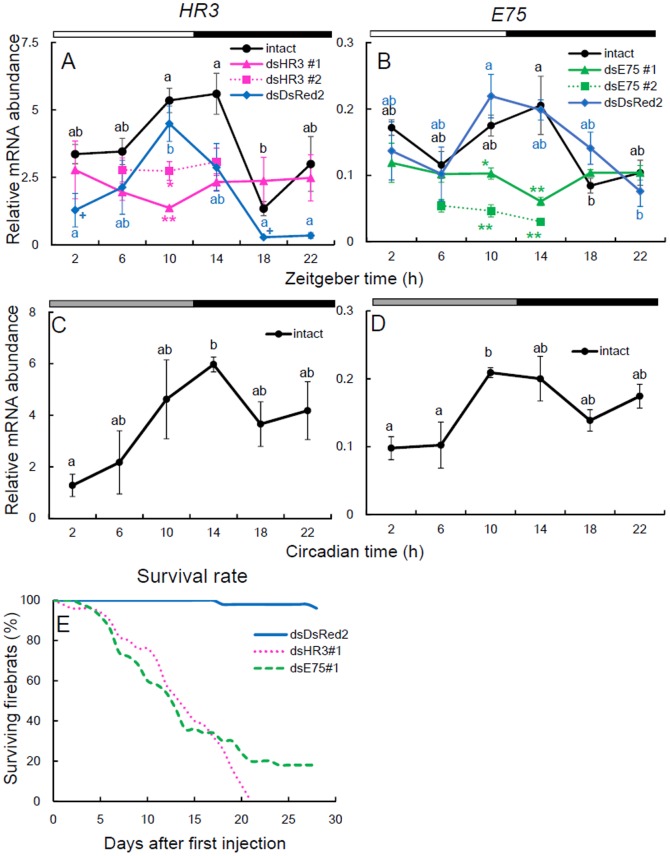
Figure 2. Expression profiles of Td'HR3 and Td'E75 mRNA and effects of their dsRNAs on their mRNA levels and the survival rate in firebrats.
Both Td'HR3 (A, C) and Td'E75 (B, D) were rhythmically expressed in LD (A, B) and DD (C, D), peaking late (subjective) day to early (subjective) night (black symbols). DsHR3#1,2 (pink triangles and squares for #1 and #2, respectively) and dsE75#1,2 (green triangles and squares for #1 and #2, respectively) downregulated mRNA levels and disrupted the rhythm of their respective genes (A and B). Treatment with dsDsRed2 as a negative control did not disrupt the rhythmic expression in both genes (A and B, blue symbols), but caused a significant decrease in Td'HR3 mRNA levels at ZT 2 and ZT 18 (+ P<0.05, t test vs intact). White, black, and gray bars above each graph indicate day, night/subjective night, and subjective day, respectively. Total RNA was extracted from firebrats collected at 4-h intervals starting 2 h after lights on or 2 h into subjective day (ZT2 or CT2, respectively). The data collected from 3–4 independent experiments were averaged and plotted as the mean ± SEM values relative to the value of rp49 mRNA used as the reference. Values with different letters significantly differ from each other within the same treatment groups (P<0.05, ANOVA with Tukey test, S1 Table). *P<0.05, **P<0.01, t test vs dsDsRed2 (exact P values are shown in S2 Table). (E) Survival rate after injection of 10.23–13.95 µg/g dsHR3, dsE75, or dsDsRed2 into the abdomen. DsHR3 and dsE75 significantly reduced the survival rate. For further explanation, see text.

