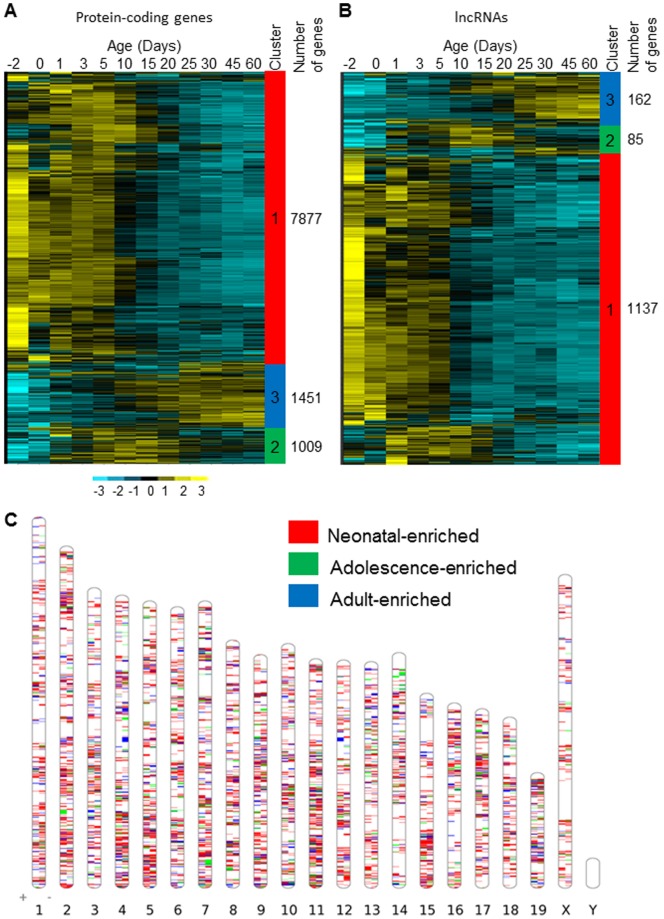
Figure 6. Developmental gene expression patterns during postnatal liver maturation.
Heat maps are drawn for all significantly differentiated expressed protein-coding (A) and lncRNA (B) genes during development in liver. Differential expressions were detected by ANOVA with adjusted p-values <0.05. For each gene, log2(FPKM+1) over the ages were converted to z-scores, and the scale bar indicates z-score values. Genes are hierarchically clustered, and the color bar on the right shows the major trends of gene expression: high relative expression at early ages (neonatal, Cluster 1), intermediate ages (adolescent, Cluster 2) and older ages (adult, Cluster 3). (C). The ideogram of the chromosomal location of genes expressed in the three major developmental patterns.

