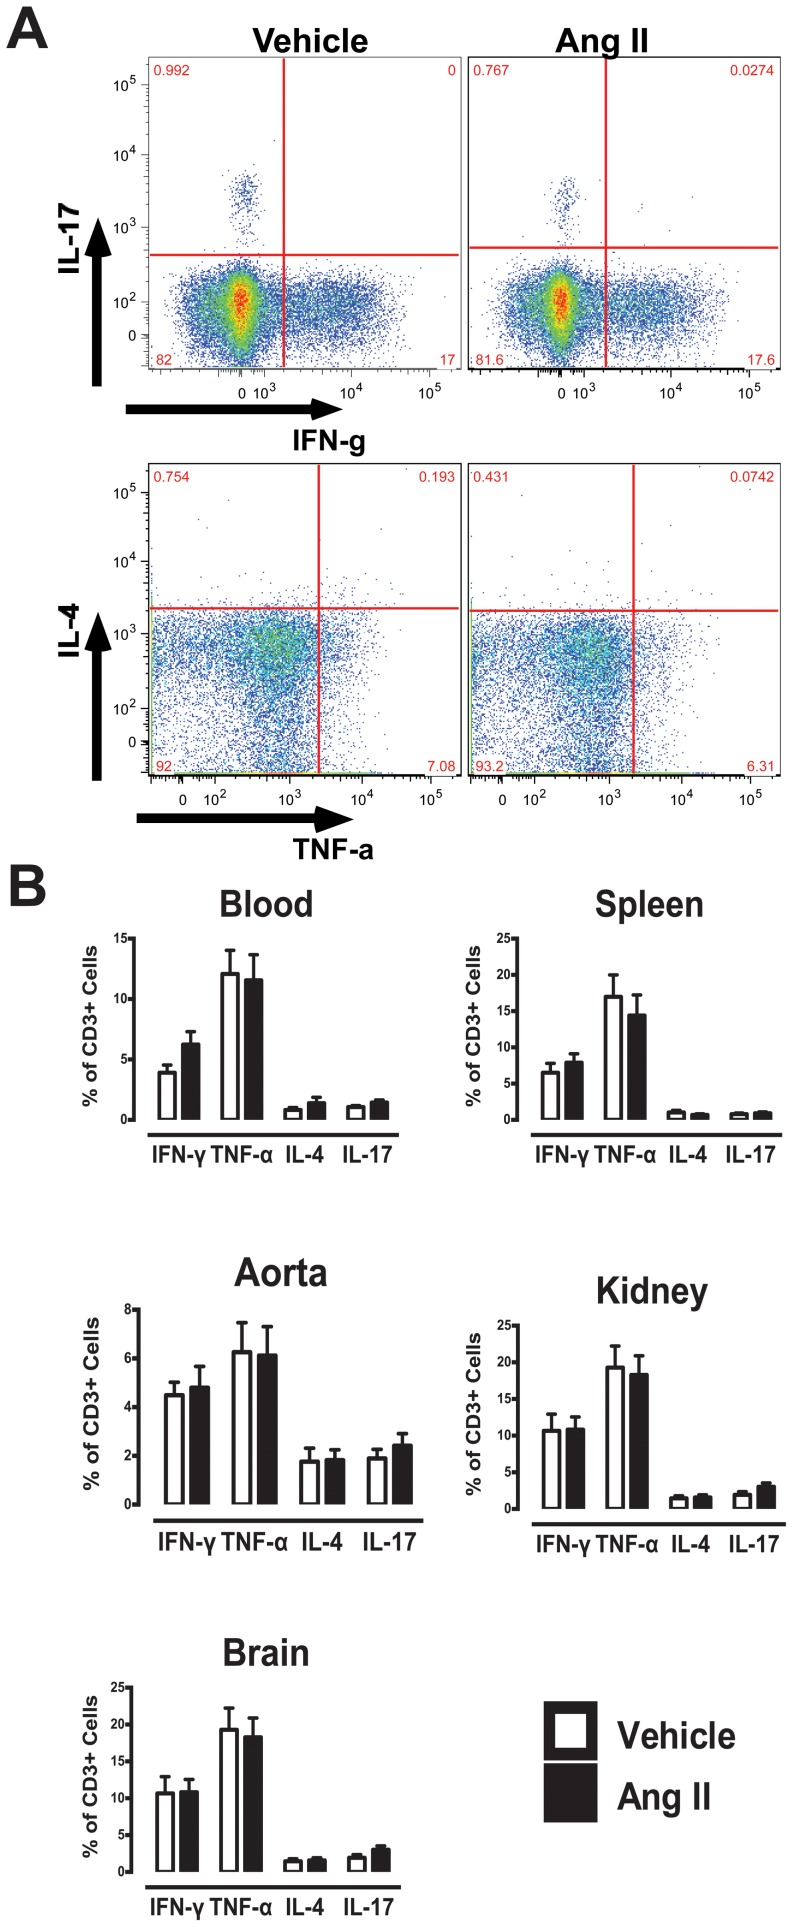
Figure 2. Intracellular FACS analysis of cytokine producing T cells (CD3+).
(A) Representative flow cytometry plots and gating strategy of IFN-γ, TNF-α, IL-4 and IL-17-producing T cells in blood. (B) Mean data of cytokine-producing T cells in vehicle- and Ang II-treated group in various organs (n = 11–19).

